


Okmeter agent is installed on physical as well as virtual servers. It will collect the data on everything happening on and with the server with no regard if it's virtual or not. That's why each server with agent installed will be billed as full unit.
Containers are monitored from the host server, so it won't increase the bill.
If you happen to have more than a hundred of servers — contact us, to discuss the price.
Monitoring thousands of server metrics, ready-made for you.
So you won’t miss a thing.
- When it breaks down
- Okmeter will notify you
- You’ll know what’s happening
- You’ll know what to do
- You’ll fix it quicker
Detalization that rocks
Okmeter auto-magically collects 100s and even 1000s of detailed metrics about every part of your system so you won’t miss a thing.
Nginx monitoring
Slow upstream responses, errors, traffic and requests balancing.
LEARN MORE
Docker monitoring
Containers resource usage, CPU, memory, disk IO, blkio ops, quotas, shares, throttling, for docker, kubernetes and k8s pods
Java / JVM monitoring
JVM heap memory pools usage, off-heap memory, threads and GC counts, GC timings.
php-fpm monitoring
Worker states, resource usage, pools starvation, queue saturation.
LEARN MORE
StatsD
Instrument your server application code to get runtime statistics — counters, rates, timers with percentiles and histograms.
MySQL monitoring
Performance metrics, transaction throughput and latencies, slow queries, innodb, Qcache, threads, and locks metrics. Full scans and range joins, tmp tables and buffer pool usage.
MongoDB monitoring
Queries runtime statistics — calls count, in/out traffic per query, mean query times and latency percentiles for each collection and query profile. Mongo errors count.
Postgresql monitoring
Connections, transactions, query timings and resource usage, locks, bgwriter, wal, xlog, indexes, seq scans, replication, autovacuum.
LEARN MORE
Cassandra monitoring
Request latencies, table ops latencies, cluster nodes errors and unavailabilities, cache stats, commit log, compaction, hinted handoff, read repairs, memtable stats, sstables and disk usage.
Elasticsearch monitoring
Сluster health, indices, replicas and shards, per index stats — size, docs count, segments, ops counts and latencies, fielddata cache and evictions.
RabbitMQ monitoring
Message publishing and delivery, acknolegments, memory usage by queues and messages counts.
Redis monitoring
Performance, memory use, commands call counts and cpu usage. Channels, patterns, connections, rdb bgsave, aof rewrites.
PgBouncer monitoring
Сonnection pool metrics, traffic received and sent, xact counts and times, query and wait times. Client states — active and waiting.
LEARN MORE
Memcached monitoring
Мemory use, hits, misses, evictions, reclaimed, slabs fill percent, cached items count, memcached commands, used chunks, hit rate, miss rate.
ZooKeeper monitoring
Nodes states, leader elections, outstanding requests, znodes, watches, ephemerals.
LEARN MORE
Detailed and meaningful DevOps
Why okmeter is perfect for you
Right metrics out of the box
To know what’s happening, you must collect proper parameters. We collected other people’s experience of how things might go south. And we figured out what metrics to collect to get all the info you need for troubleshooting.
Auto-detect of common pitfalls
Okmeter has a large knowledge base of typical problems that regularly occur with commonly-used technologies. Okmeter will automatically run 100s of diagnostic checks for each of your servers and subsystems.
Auto-magical integration
Okmeter will automatically detect every service, process and technology in your cluster and collect all needed metrics. It’ll appear organized in meaningful chart dashboards. All that with no configuration.
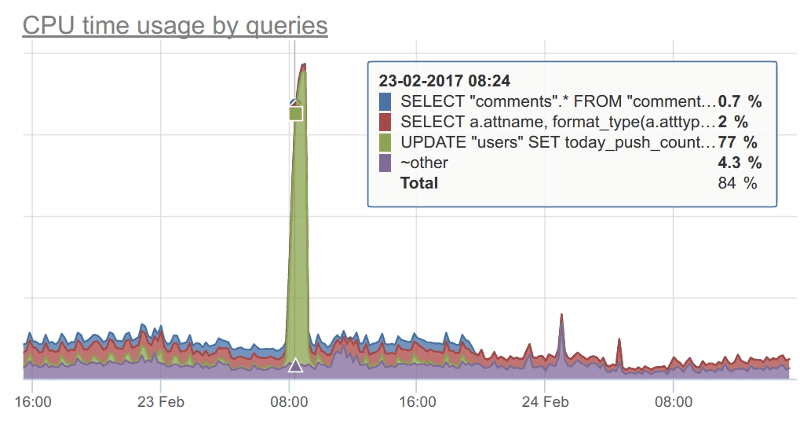
Cluster overview with drill-down
Okmeter metrics engine allows combining 1000s of metrics in one chart to get an overview of your whole cluster. And still you can drill-down to any specific subset you want. That allows you to pinpoint perf issues and root causes easily.
Some of our clients
Usefulness that matters
Expert level chart dashboards will guide you through what's going on with your DB, service, server.
Clear view into
PostgreSQL performance
To know what’s happening, you need to collect proper parameters. We collected other people’s experience of how things might go south. And we figured out what metrics to collect to get all the info you need for troubleshooting.
Nginx
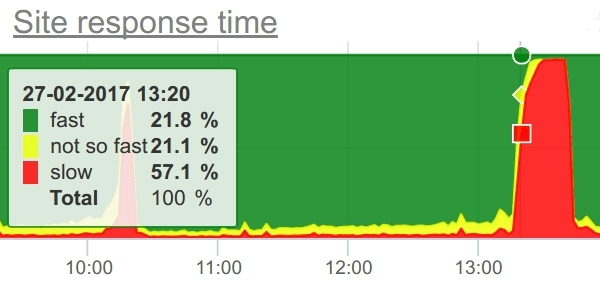
Keep track of every user request with access.log monitoring. Pinpoint slow backend responses and unstable pages.
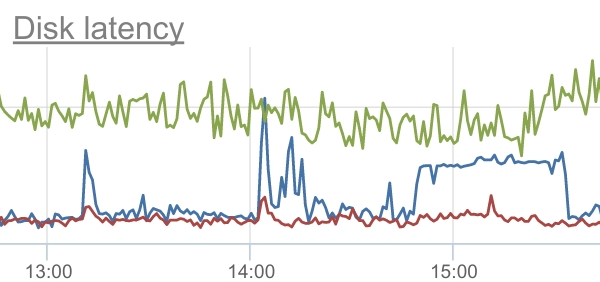
Detailed resource utilization
Beware of what's happening with your hardware. Whether RAID performance is poor or the CPU is overheated — you'll be notified.
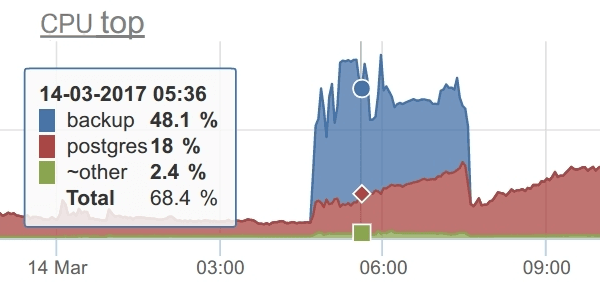
Detailed process monitoring
Easily detect when processes behave badly. Okmeter accounts for CPU, memory, disk io, swap usage of each process.
How it works
1
Install okmeter agent on your servers
Okmeter agent detects every process running on a server and auto-configures all needed plugins.
2
It will collect, process and send metrics to okmeter.
Preset expert level dashboards for every piece of your stack. These charts will tell you the full story.
3
Everything is under control now!
Every minute, okmeter checks a whole bunch of triggers. And you'll get paged if something’s wrong.
Pricing
Free trial. No credit card required.
Hacker
5$
per month / per server
- Only Basic metrics*
- 1 week data retention
- email notifications
Lite
19$
per month / per server
- 1 week data retention
- SMS/email notifications
- Email support
Standard
25$
per month / per server
- 2 month data retention
- SMS/email notifications
- Slack integration
- Email support
Available on-premises
Enterprise
- 1 year data retention
- Slack, Jira and custom integrations
- SAML single sign-on
- 24/7 support
* Basic metrics: cpu, ram, disc, network, processes
FAQ
In order for okmeter agent to play nicely with Auto Scale, you should install it into the image or setup agent installation in startup/cloud-init scripts.
Okmeter billing works by 95% burstable method, i.e. for each month 5% of the time with the maximum number of hosts is ignored.
We understand that it might be not very suitable in some cases and we're commited to do something better with it. Meanwhile, please, contact us, to discuss possible solutions.
For restricted enviroments Okmeter might be shipped as a managed on-prem installation. I.e. you provide us with servers (or AWS sub account).
Okmeter team deploys and manages a private Okmeter server just for you.
All your monitoring data won't leave your premises.
Contact us, if you need to sign an NDA or discuss this further.
Do you have more questions? Ask us anything.