Built-in plugins
The Okmeter agent will automatically monitor:- CPU usage
- Load average
- Memory
- Swap: usage, I/O
- Disks: usage, I/O
- All processes: CPU, memory, swap, disk I/O, open files
- TCP connections: states, ack backlog, RTT
- Memcached
- Redis
- Nginx access logs
- Raid
- Zookeeper
Configuring Nginx
Okagent requires a certain format of NGINX access logs to work properly. Here is how you can configure it:- Add a new
log_format(or modify the existing one) in/etc/nginx/nginx.conf: - Use this format for each
access_logdirective in Nginx configuration.
Generally, you only need to make changes to/etc/nginx/nginx.conf: -
Reload Nginx:
sudo /etc/init.d/nginx reload
http {
        ...
        log_format combined_plus '$remote_addr - $remote_user [$time_local]'
                                 ' "$request" $status $body_bytes_sent "$http_referer"'
                                 ' "$http_user_agent" $request_time $upstream_cache_status'
                                 ' [$upstream_response_time]';
        ...
}
http {
        ...
        access_log /var/log/nginx/access.log combined_plus;
        ...
}
If no format is specified, the default predefined
combined format is used. It does not contain the $request_time, $upstream_cache_status, $upstream_response_time variables. You need to find all access_log directives and specify the format that contains all the required variables.
PostgreSQL
If you use PostgreSQL on Amazon AWS RDS | AWS Aurora Postgres | Google Cloud SQL | Azure Database for PostgreSQL, do the preliminary configuration, then return to this section and follow all the steps described below.A dedicated Okagent user is needed to monitor PostgresSQL. Okagent will use it to connect to the database instance. On top of that, you have to create a helper function in the Postgres database for collecting monitoring data. To do so, run the following commands:
$ sudo su postgres -c "psql -d postgres"
CREATE ROLE okagent WITH LOGIN PASSWORD 'EXAMPLE_PASSWORD_DONT_USE_THAT_please_!)';
CREATE SCHEMA okmeter; -- So that helper won't mix with anything else.
GRANT USAGE ON SCHEMA okmeter TO okagent; -- So okmeter agent will have access to it.
CREATE OR REPLACE FUNCTION okmeter.pg_stats(text) -- For okagent to get stats.
RETURNS SETOF RECORD AS
$$
DECLARE r record;
BEGIN
    FOR r IN EXECUTE 'SELECT r FROM pg_' || $1 || ' r' LOOP RETURN NEXT r;  -- To get pg_settings, pg_stat_activity etc.
    END loop;
    RETURN;
END
$$ LANGUAGE plpgsql SECURITY DEFINER;
Next, add the okagent user to pg_hba.conf (pg_hba.conf docs):
host all okagent 127.0.0.1/32 md5For PostgreSQL on Amazon AWS RDS | AWS Aurora Postgres | Google Cloud SQL change
local all okagent md5
127.0.0.1 in pg_hba.conf to the IP address of the server where Okagent is running.
To apply the changes in pg_hba.conf, run the following commands::
$ sudo su postgres -c "psql -d postgres"
SELECT pg_reload_conf();All set!
If you're using PostgreSQL on Amazon AWS RDS | AWS Aurora Postgres | Google Cloud SQL | Azure Database for PostgreSQL — check out these setup instructions.
PostgreSQL query statistics
The pg_stat_statements extension must be enabled to collect SQL statements / query runtime and execution statistics.This is a standard extension developed by the Postgres comunity. It is well-tested and is available on most Database as a Service solutions such as AWS RDS, AWS Aurora Postgres.
If you're using Postgres version 9.6 or less, install the
postgres-contrib package using the package manager for your Linux distribution. You can also download it from postgresql.org.
Then, configure Postgres to load the extension by adding these lines to your
postgresql.conf:
shared_preload_libraries = 'pg_stat_statements'   # change requires DB restart.
pg_stat_statements.max = 500
pg_stat_statements.track = top
pg_stat_statements.track_utility = true
pg_stat_statements.save = false

# #Also consider enabling I/O timing traction by uncommenting this:
#track_io_timing = on
We recommend reading this section on runtime statistics first.
Restart postgresql:
/etc/init.d/postgresql restart...
...and enable the extension via psql:
$ sudo su postgres -c "psql -d postgres"
CREATE EXTENSION pg_stat_statements;
PgBouncer
To monitor PgBouncer, add theokagent user to /etc/pgbouncer/userlist.txt (or another file referred by the auth_file directive in pgbouncer.ini):
if PgBouncer auth_type = md5
"okagent" "EXAMPLE_PASSWORD_DONT_USE_THAT_please_!)"
if PgBouncer auth_type = scram-sha-256 (hash may change every page refresh, but it is not necessary to update it in config every time)
"okagent" "EXAMPLE_PASSWORD_DONT_USE_THAT_please_!)"
Next, add it to the list of stats_users in pgbouncer.ini:
; the comma-separated list of users who are only allowed to use the SHOW command
stats_users = okagent
Restart PgBouncer to apply settings: /etc/init.d/pgbouncer reload
JVM
To monitor the JVM, you must enable JMX. To do this, add the following arguments to the JVM start command:-Dcom.sun.management.jmxremote -Dcom.sun.management.jmxremote.host=127.0.0.1 -Djava.rmi.server.hostname=127.0.0.1 -Dcom.sun.management.jmxremote.port=9099 -Dcom.sun.management.jmxremote.authenticate=false -Dcom.sun.management.jmxremote.ssl=false
Q: What if there is more than one JVM running on the server?
A: You can specify different JMX ports to use. If the JVM is running with `authenticate=false` and `ssl=false` parameters, Okagent will automatically collect monitoring data.
Php-fpm
To monitor php-fpm, you have to enable status page for each pool. Uncomment thepm.status_path directive for all pools in all .conf files and set the URL for the status page:
pm.status_path = /status ;you can use /status or any other URL, okagent will work with thatRestart php-fpm to apply the settings:
service php-fpm restart or docker restart some-php-container. The okmeter agent will start collecting pool metrics.
RabbitMQ
To monitor RabbitMQ you need to enable the rabbitmq_management plugin and create a user for Okagent. To do so, run the following commands on each RabbitMQ server:rabbitmq-plugins enable rabbitmq_management
rabbitmqctl add_user okagent EXAMPLE_PASSWORD_DONT_USE_THAT_please_!)
rabbitmqctl set_user_tags okagent monitoring
And grant permissions to the okagent user for vhosts:
rabbitmqctl set_permissions -p / okagent ".*" ".*" ".*"
rabbitmqctl set_permissions -p /vhost1 okagent ".*" ".*" ".*"
You can get a list of
vhosts with the following command:
rabbitmqctl list_vhosts
Mysql
For monitoring Mysql, you need to create a dedicated user to connect to the database instance. To do this, run the following commands:
CREATE USER 'okagent'@'%' IDENTIFIED BY 'EXAMPLE_PASSWORD_DONT_USE_THAT_please_!)';
GRANT PROCESS, REPLICATION CLIENT ON *.* TO 'okagent'@'%';
GRANT SELECT ON `performance_schema`.* TO 'okagent'@'%';
FLUSH PRIVILEGES;
The okmeter agent uses events_statements_summary_by_digest table from performance_schema to collect statistics on MySQL queries. It is available in all modern MySQL, Percona, and MariaDB engines. To check for compatibility, run the command:
mysql> SELECT 'OK' FROM INFORMATION_SCHEMA.TABLES WHERE TABLE_SCHEMA='performance_schema' AND TABLE_NAME='events_statements_summary_by_digest';
+----+
| OK |
+----+
| OK |
+----+
If the result of the query is "OK", you must check that the
performance_schema is enabled and initialized. To do this, run the following commands:
mysql> SHOW VARIABLES LIKE 'performance_schema';
+--------------------+-------+
| Variable_name      | Value |
+--------------------+-------+
| performance_schema | ON    |
+--------------------+-------+
If the result of the query is "OFF", you must enable
performance_schema in my.conf and restart MySQL:
[mysqld]
performance_schema=ON
If you use a cloud-based MySQL such as Amazon AWS RDS | AWS Aurora | Google Cloud SQL | Azure | Oracle Cloud, follow these setup instructions!
Remote and cloud databases — AWS RDS | AWS Aurora | Cloud SQL | Azure Database for PostgreSQL | Elasticsearch | Redis
To monitor cloud and remote databases (i.e., databases running on hosts that do not have Okagent installed), you can install Okagent on a separate host (e.g., an AWS EC2 instance) and configure it accordingly.
Currently, the following remote and cloud databases are supported: Elastic Search, Redis, MySQL, PostgreSQL
You can also use an existing server / EC2 instance with DB access, such as your web-application, which probably already has access to the database through a security group or similar.
Next, create a config (e.g., /usr/local/okagent/etc/config.d/remote_db.yaml) for the okmeter monitoring agent in the /usr/local/okagent/etc/config.d/ directory of the server | EC2 instance where Okagent is running with the following contents:
For MySQL or PostgreSQL:
plugin: postgresql # or mysql
config:
  host: db_ip # replace with your remote DB instance or cluster endpoint
  #port: db_port # uncomment and replace with your remote DB instance port if it's non-standard
  user: db_user # replace with your remote DB instance monitoring user
  password: db_password # replace with your remote DB instance monitoring user's password.
  #database: mydb # replace with the database name you used to connect to when you created the okmeter schema, user, and function in PostgreSQL, if different from "postgres"
For Redis:
plugin: redis
config:
  host: db_ip # replace with your remote DB instance or cluster endpoint
  #port: db_port # uncomment and replace with your remote DB instance port if it's non-standard
  #password: db_password # uncomment and replace with your remote DB instance monitoring user's password.
For Elasticsearch:
plugin: elasticsearch
config:
  host: elasticserch_url # replace with your Elasticsearch IP in the following format: xx.xx.xx.xx
  #port: db_port # uncomment and replace with your remote Elasticsearch port if it's non-standard (9200)
  #user: db_user # uncomment and replace with your remote Elasticsearch monitoring user
  #password: db_password # uncomment and replace with your remote Elasticsearch monitoring user's password.
  #insecureTls: true # uncomment if Elasticsearch is configured to use a self-signed certificate
Restart Okagent to apply changes: $ sudo /etc/init.d/okagent restart (or $ sudo systemctl restart okagent.service).
Make sure that the monitoring user has sufficient database permissions — refer to the Mysql plugin or Postgresql plugin documentation.
Zookeeper
For Zookeeper 3.4.10 or higher, add stat and mntr commands to the whitelist in your zoo.cfg:
4lw.commands.whitelist=stat, mntr
No additional configuration is required for Zookeeper versions earlier than 3.4.10.
Sending custom metrics
In addition to built-in metrics, Okmeter can process custom metrics. There are several ways to send your own metrics:
- Write an SQL query that returns some numerical values from the database using the SQL query plugin.
- Parse log files using the Logparser plugin.
- Write a script that dumps metrics to stdout and invoke it periodically using the Execute plugin.
- Parse responses from the HTTP endpoint using the HTTP plugin.
- Gather information from the output of Redis commands using the Redis query plugin.
- Collect metrics from an application using Statsd.
- Collect metrics from Promethus-compatible exporters using the Prometheus plugin.
These plugins require additional configuration files. Okagent reads all configuration files in the
/usr/local/okagent/etc/config.d/ directory. The name of the configuration file can be anything, the extension must be .yaml, and the file format is YAML.
Verifying configuration files | dry run mode
You can check the syntax of the configuration file with the following command (replace PLUGIN_CONFIG_FILE with your file):
$ /usr/local/okagent/okagent -dry-run=/usr/local/okagent/etc/config.d/PLUGIN_CONFIG_FILE
If the command does not result in errors, apply the configuration file by restarting Okagent: $ sudo /etc/init.d/okagent restart (or $ sudo systemctl restart okagent.service).
SQL query plugin
The SQL query plugin uses periodic queries to the database to collect the necessary information and generate custom metrics based on it.
The plugin is currently compatible with PostgreSQL, MySQL, Microsoft SQL Server, and ClickHouse.
Example. Suppose, you have an article_updates table in your database:
    update_type | character varying(16)
    updated     | timestamp without time zone
    ...
Now, you want to monitor how many new updates of different types are coming in each time period. You can use the following query to collect the necessary information:
SELECT COUNT(*) AS value, update_type FROM labels WHERE updated BETWEEN NOW() - INTERVAL '60 seconds' AND NOW() GROUP BY update_type
Note: Check the query execution plan before configuring Okagent. Although these queries are performed infrequently (every minute), they can still create an additional load on the database.
Okagent will periodically request the necessary information from the database. As a result you will get the following chart:
Note: Okmeter uses the value query field as metric value (floating point). All other values from the query result (update_type in the example above) will be added to the metric as labels with matching names. Okmeter can then use them to draw metrics with different label values separately (like in the chart above).
The above example corresponds to the following /usr/local/okagent/etc/config.d/article_updates.yaml YAML configuration file:
plugin: postgresql_query # or mssql_query or mysql_query or clickhouse_query config: host: '127.0.0.1' port: 5432 db: some_db user: some_user password: secret query: "SELECT COUNT(*) AS value, update_type FROM labels WHERE updated BETWEEN NOW() - INTERVAL '60 seconds' AND NOW() GROUP BY update_type" metric_name: demo_documents_update_rateThis config will produce a demo_documents_update_rate metric.
Note:Metrics and label names can only contain ASCII characters and numbers and must satisfy the regular expression [a-zA-Z_][a-zA-Z0-9_]*
Note: Verify that the configuration file is correct before using it.
Note: Restart Okagent to apply the configuration: $ sudo /etc/init.d/okagent restart (or $ sudo systemctl restart okagent.service).
Execute plugin
This plugin sends custom metrics generated by an external process, based on data obtained from its standard output stream. Two types of parsers can be used to generate metrics: Regexp or Json.
Regexp plugin
The Regexp parser parses the strings obtained from the script and converts them into a metric value and additional labelset sets. For example, to send a metric on the basis of du command execution, you need to create a /usr/local/okagent/etc/config.d/app_log_disk_usage.yaml configuration YAML-file with the following contents:
plugin: execute
config:
command: 'du /var/log/app/main.log'
regexp: '(?P<value>\d+)'
name: demo_app_log_size # metric name
value: value # metric value
labels: # metric labels
log_name: main
This config will generate a demo_app_log_size metric.
Note: Metrics and label names can only contain ASCII characters/digits and must match the [a-zA-Z_][a-zA-Z0-9_]* regular expression.
Note: Verify that the configuration file is correct before using it.
Note: Restart Okagent to apply the configuration: $ sudo /etc/init.d/okagent restart (or $ sudo systemctl restart okagent.service).
JSON
The JSON parser can be used for sending ready-made metrics or several metrics simultaneously.
Note: The script output result must be in JSON format and must contain name and value fields; additional labels must be listed in the field named labels:
{
"name": "metric1",
"labels": {"label1": "foo", "label2": "bar"},
"value": 123.4
}
Example. Suppose there is a calc_metrics.sh Bash script with the following content:
echo '{"name": "metric1", "labels": {"label1": "foo", "label2": "bar"}, "value": 123.4}'
To send metrics using the Execute plugin and this script, you need to create a /usr/local/okagent/etc/config.d/execute_json.yaml YAML configuration file as follows:
plugin: execute config: command: /tmp/calc_metrics.sh parser: json
Example. A script that can send several metrics at once would look like this:
echo '[{"name": "metric1", "value": 123.4}, {"name": "metric2", "value": 567}]'
Note: Metrics and label names can only contain ASCII characters/digits and must match the [a-zA-Z_][a-zA-Z0-9_]* regular expression.
Note: Verify that the configuration file is correct before using it.
Note: Restart Okagent to apply the configuration: $ sudo /etc/init.d/okagent restart (or $ sudo systemctl restart okagent.service).
Logparser plugin
This plugin sends metrics retrieved from custom log files. You can use Regexp or JSON parsers to generate metrics.
Regexp
The Regexp parser analyzes each line of the file and converts it into a metric value and additional labelset sets. For example, to send metrics based on the /var/log/app/stages.log log file, you need to create a /usr/local/okagent/etc/config.d/stage_log.yaml configuration YAML file with the following contents:
plugin: logparser
config:
file: /var/log/app/stages.log
regexes:
# 2015-11-21 15:42:36,972 demo [DEBUG] page=item stages: db=0.007s, render=0.002s, total=0.010s count=1
- regex: '(?P\d{4}-\d{2}-\d{2} \d{2}:\d{2}:\d{2}).+ page=(?P\w+) stages: db=(?P\d+\.\d+)s, render=(?P\d+\.\d+)s, total=(?P\d+\.\d+)s count=(?P\d+)'
time_field: datetime
time_field_format: '2006-01-02 15:04:05'
metrics:
...
Here:
- file — path to the file to be analyzed. Okagent handles file rotation correctly;
- regexes — list of regular expressions to apply to strings. Regular expressions are applied sequentially;
- regexp — Perl-compatible regular expression (
regex). It is used to split the string into named groups for further transformation into metrics; - time_field — name of the timestamp group;
- time_field_format — format of timestamps;
- metrics — list of metrics to send together with the rules for converting strings into metrics.
JSON
The JSON parser converts the JSON-formatted logs into metrics. This method is preferable because it creates less overhead and does not require parsing using regular expressions.
plugin: logparser
config:
file: /var/log/app/stages.log
json: true
# {ts: "2015-11-21 15:42:36.000+0300", user: "demo", page: "item", db: "0.007", render: "0.002", total: "0.010", count: "1"}
time_field: ts
time_field_format: "2006-01-02 15:04:05.000-0700"
metrics:
...
Here:
- file — path to the file to be analyzed. Okagent handles file rotation correctly;
- json — type of the parser (JSON);
- time_field — name of the timestamp group;
- time_field_format — timestamp format.
TOP
Log parsing often leads to significant metric churn which negatively affects the display of graphs. For metrics based on log files, we recommended using the TOP function. It limits the number of metrics to N (where N is the parameter defined in the configuration file) and sums up all other metrics and sends them as an additional metric with the label: ~other value.
Example. Suppose we want to parse the /var/log/app/stages.log log file containing information about users' requests to the service. However, we want metrics only for the ten most frequent requests over the last 10 minutes. To implement this logic, create a /usr/local/okagent/etc/config.d/top_url.yaml YAML configuration file with the following contents:
plugin: logparser
config:
file: /var/log/app/stages.log
#{"ts":"2018-09-12 13:07:11.500","logger": "requests","time":"33","method":"PUT","status":200,"uri":"/aaa/bbb","rid":noRequestId,ip":"2.2.2.2"}
#{"ts":"2019-11-20 18:32:49.851+0300","logger":"requests","time":"157","method":"PUT","status":200,"uri":"/foo/bar?from=header_new","rid":"11","ip":"1.1.1.1"}
json: true
time_field: ts
time_field_format: "2006-01-02 15:04:05.000-0700"
top_vars:
topurl:
source: uri
weight: 1
threshold_percent: 1
window_minutes: 10
metrics:
- type: rate
name: service_requests_rate
labels:
method: =method
url: =topurl
status: =status
- type: percentiles
name: service_response_time_percentiles
value: ms2sec:time
args: [50, 75, 95, 99]
- type: percentiles
name: service_response_time_percentile_by_url
value: ms2sec:time
args: [95]
labels:
url: =topurl
The top_vars sections has the following fields:
topurlis a new label for the metric to get TOPN URIs (thesource: uriJSON field –);weight– increments the metric counter at each URI hit for;threshold_percent– metrics whose total sum is below this threshold are combined into a special cumulative metric (~other).window_minutes– window size to use for TOP calculation (in minutes).
The metric type can be one of the following:
-
rate— average growth rate of the metric per minute. It is used by default. -
percentile— collects the n-th percentile of values per minute. Theargskey is an array of percentage values, e.g.,[50, 95, 99]. -
maxormin— collects the maximum or minimumvaluefor the metric per minute. -
threshold— collects the rate ofvaluehits in different intervals (e.g.,(-∞, 0.5],(0.5, 1], ...).
time_field — name of the field to store metric timestamps.
time_field_format can be one of the following:
unix_timestamp— floating point number with the Unix time timestampcommon_log_format— this format parses time and date values as follows:2/Jan/2006:15:04:05 -0700time_iso8601— the RFC 3339 format (also known as ISO 8601)- The custom timestamp format. The user specifies how the reference time, e.g.
Mon Jan 2 15:04:05 -0700 MST 2006, should be formatted to the time format of your log. It is used as a template for the Logparser plugin.
If no time zone information is available, the UTC time zone is used.
Metric may have a labels object with static (stage: db) and dynamic (page: =page) labels. The = sign before the label value (e.g., page: =page in the example above) means
that the actual value should be taken from the regular expression group named page.
Example. Suppose that the application log contains the following entries:
2015-11-01 22:51:44,072 demo [DEBUG] page=item stages: db=0.005s, render=0.002s 2015-11-01 22:51:44,087 demo [DEBUG] page=list stages: db=0.003s, render=0.001s ...
If you apply the configuration file shown below,...
plugin: logparser
config:
file: /var/log/app/stages.log
regexes:
# 2015-11-21 15:42:36,972 demo [DEBUG] page=item stages: db=0.007s, render=0.002s, total=0.010s count=1
- regex: '(?P<datetime>\d{4}-\d{2}-\d{2} \d{2}:\d{2}:\d{2}).+ page=(?P<page>\w+) stages: db=(?P<db>\d+\.\d+)s, render=(?P<render>\d+\.\d+)s, total=(?P<total>\d+\.\d+)s count=(?P<count>\d+)'
time_field: datetime
time_field_format: '2006-01-02 15:04:05'
metrics:
- type: percentiles
args: [50, 75, 95, 98, 99]
value: db
name: demo_stages_percentiles
labels:
stage: db
- type: percentiles
args: [50, 75, 95, 98, 99]
value: render
name: demo_stages_percentiles
labels:
stage: render
- type: rate
name: demo_requests_rate
labels:
page: =page
- type: rate
name: demo_documents_rate
value: count
labels:
page: =page
- type: threshold
value: total
args: [0.05, 0.1]
name: demo_render_histogram
labels:
page: =render
... the Logparser plugin would post the following metrics: demo_requests_rate, demo_documents_rate, demo_stages_percentiles, and demo_render_histogram.
Note: Verify that the configuration file is correct before using it.
Note: Restart Okagent to apply the configuration: $ sudo /etc/init.d/okagent restart (or $ sudo systemctl restart okagent.service).
HTTP plugin
This plugin sends custom metrics about the availability of the HTTP service, as well as metrics derived from parsing the response to an HTTP request.
Example: Suppose, there is an HTTP service with access restricted by Basic Auth. The response to the request at /service/stat looks as follows:
curl --user name:password -H 'Foo: bar' -v 'http://127.0.0.1:8080/service/stat' > GET /service/stat HTTP/1.1 > Host: 127.0.0.1 > Authorization: Basic bmFtZTpwYXNzd29yZA== > Foo: bar > < HTTP/1.1 200 OK < online_users=140 active_users=10
To post custom metrics obtained by parsing the response to an HTTP request, you have to create a /usr/local/okagent/etc/config.d/http.yaml configuration YAML-file as follows:
plugin: http
config:
url: http://127.0.0.1:8080/service/stat
username: name
password: password
#sslskip: on #optional, disable certificate verification, like curl --insecure
headers:
foo: bar
metrics:
- metric: users_online
regex: 'online_users=(\d+)'
- metric: users_active
regex: 'active_users=(\d+)'
The request will be performed every minute, and the following two metrics will be sent upon parsing the response received:
metric(name="users_online") metric(name="users_active")
On top of that, the plugin will generate three additional metrics:
metric(name="status", plugin="http", instance="<config filename>")
The request status will be "1" if the request was successful, and "0" otherwise.
metric(name="status", plugin="http", instance="type="text", value="")
The value label will be empty if the request was completed without errors. Otherwise, the value label will contain an error that occurred while executing the request.
metric(name="http.request_time", plugin="http", instance="<config filename>")
The request execution time will be passed as the value of this metric.
Note: Metrics and label names can only contain ASCII characters/digits and must match the [a-zA-Z_][a-zA-Z0-9_]* regular expression.
Note: Verify that the configuration file is correct before using it.
Note: Restart Okagent to apply the configuration: $ sudo /etc/init.d/okagent restart (or $ sudo systemctl restart okagent.service).
Redis query
This plugin allows you to collect custom metrics based on Redis commands. An example of the /usr/local/okagent/etc/config.d/redis_example.yaml configuration file is shown below:
plugin: redis_query
config:
#host: 127.0.0.1 #optional
#port: 6379 #optional
#database: 0 #optional
commands:
- LLEN achievement_queue
- SCARD some_queue
- HGET stat active_connections
- GET mail_sender_queue_len
A plugin with this configuration will collect four metrics:
metric(name="achievement_queue.llen") metric(name="some_queue.scard") metric(name="stat.hget", param="active_connections") metric(name="mail_sender_queue_len.get")
The following Redis commands are supported: BITCOUNT, GET, GETBIT, GETRANGE, HGET, HLEN, HSTRLEN, LINDEX, LLEN, PTTL, SCARD, STRLEN, TTL, ZCARD, ZCOUNT, ZLEXCOUNT, ZRANK, ZREVRANK, ZSCORE.
Statsd / Application metrics
What is this for?
For most programming languages, there are ready-to-use statsd client libraries available. With them, you can easily collect metrics from an application (e.g., counters and timers) and pass them to the Okagent agent over UDP. Okagent will then aggregate the received metrics and relay them to Okmeter for graphing and alerting.
Okagent accepts UDP connections on port 8125 and processes StatsD metrics like counts, timings, and gauges.
An example of streaming metrics from an application via StatsD
Below is an example of using the pystatsd library in a web application written in Python:
from statsd import StatsClient statsd_client = StatsClient(host='127.0.0.1', port=8125, prefix='demo') def item(*args, **kwargs): statsd_client.incr('view.get.demo.views.item.hit') #what a long metric name! return Items.get()
The following metrics will be collected:
metric(source_hostname="backend1",
name="demo.view.get.demo.views.item.hit", …) #equals to call count of "item" function
metric(source_hostname="backend1",
name="demo.view.get.demo.views.item.hit.rate", …) #and this is the calls-per-second rate
Based on these metrics, the following graphs can be generated:
You can also measure function (or part of function) execution time — a special Timers type allows you to do this:
def list(*args, **kwargs):
with statsd_client.timer('view.get.demo.views.list.total'):
return get_list_with_some_work()
In this case, the following metrics will be collected:
metric(name="demo.view.get.demo.views.list.total.mean", …) metric(name="demo.view.get.demo.views.list.total.count", …) metric(name="demo.view.get.demo.views.list.total.lower", …) metric(name="demo.view.get.demo.views.list.total.upper", …) metric(name="demo.view.get.demo.views.list.total.percentile", percentile="50", …) metric(name="demo.view.get.demo.views.list.total.percentile", percentile="75", …) metric(name="demo.view.get.demo.views.list.total.percentile", percentile="90", …) metric(name="demo.view.get.demo.views.list.total.percentile", percentile="95", …) metric(name="demo.view.get.demo.views.list.total.percentile", percentile="97", …) metric(name="demo.view.get.demo.views.list.total.percentile", percentile="99", …)
The following graphs can be plotted based on these metrics:
StatsD usage guidlines
Real-life projects may have hundreds and sometimes thousands of metrics. With so many of them, it is extremely important to name them appropriately. Doing so allows you to define various graphs quickly and conveniently. We often find that users try to minimize the number of labels and put all information in the name of a metric, e.g., myapp.some.really.long.metrics.names or some.other.long.metric.name. When plotting graphs, you have to specify the full metric name, which is often time consuming and complicates the description of graphs and alert triggers. In addition, when a new metric appears, you will have to make changes to the graph.
We recommend using the Metrics 2.0 naming standard with orthogonal tags for every dimension.
In this case, instead of clumsy demo.view.get.demo.views.list.total.mean you'll get a sort of self-describing metric name such as:
metric(name="demoapp.view.timing.mean", phase="total", handler="search", method="get")
Here, name indicates a specific measurement target — execution time of the view.timing function in the example above. All additional information should be put in this metric's labels.
Below is an example of a possible StatsD-based implementation:
stats = StatsClient(host='127.0.0.1', port=8125, prefix='demoapp') def search(request): with stats.timer('view.timing.phase_is_total.handler_is_search.method_is_'+request.method): return get_list_with_some_work() def get_item(*args, **kwargs): with stats.timer('view.timing.phase_is_total.handler_is_get_item.method_is_'+request.method): return get_list_with_some_work()
Say, if you want to add tag_1 with the some_value value and tag_2 with the other_val value to a metric named
my.precious.metric,you can do that as follows: my.precious.metric.tag_1_is_some_value.tag_2_is_other_val.
The order of the labels does not matter. The variant my.precious.metric.tag_2_is_other_val.tag_1_is_some_value is as good as the first one and will work, too.
It is not recommended to use a large number of different values for a single label. For example, storing the full URL as a label value (especially with numerical IDs like /path/url/123) is a bad idea because it leads to sending a large number of metrics and negatively affects the display speed. Also, it usually doesn't make sense.
It is recommended to use no more than 5 labels for each metric and define no more than 10 different values for each label.
Advanced configuration
By default, Okagent accepts UDP requests on port 8125.
If this port is not available, you can override it by creating a /usr/local/okagent/etc/config.d/statsd.yaml configuration file:
plugin: statsd
config:
listen_address: "192.168.1.1:18125"
gauge_age_threshold_seconds: 3600 # seconds to keep values for stale gauges
Note: Verify that the configuration file is correct before using it.
Note: Restart Okagent to apply the configuration: $ sudo /etc/init.d/okagent restart (or $ sudo systemctl restart okagent.service).
Note: After these changes take effect, Okagent will no longer use the default port (8125) for UDP requests.
Prometheus
This plugin allows scraping data from Prometheus-compatible exporters and sending them as metrics.
It scrapes each discovered exporter and produces metrics, for example, the http_request_duration_seconds histogram:
metric(name="http_request_duration_seconds_count", handler="/", method="GET", code="200", ...) metric(name="http_request_duration_seconds_sum", handler="/", method="GET", code="200", ...) metric(name="http_request_duration_seconds_bucket", handler="/", method="GET", code="200", le="0.1", ...) metric(name="http_request_duration_seconds_bucket", handler="/", method="GET", code="200", le="0.5", ...) ...
For applications running in Kubernetes, endpoint discovery is based on annotations:
apiVersion: apps/v1
kind: Deployment #or StatefulSet, DaemonSet, CronJob, ...
metadata:
name: my-app
annotations:
prometheus.io/scrape: "true"
prometheus.io/scheme: "http"
prometheus.io/port: "80"
prometheus.io/path: "/metrics"
...
Okagent can also discover exporters running in Docker containers with the appropriate labels:
docker run --name my-app \
--label io.prometheus.scrape=true \
--label io.prometheus.port=80 \
--label io.prometheus.scheme=http \
--label io.prometheus.path="/metrics" \
...
On top of that, Okagent can scrape metrics from custom targets defined in the configuration file. The data is collected as long as Okagent receives valid responses. An example of a plugin configuration file is shown below:
plugin: prometheus
config:
targets:
- http://localhost:9100/metrics
# max cardinality (default 5000)
limit: 1200
# additional labels for all scraped metrics
labels:
exporter: node
If necessary, you can specify authentication credentials. Basic Authorization and Bearer tokens are currently supported. Example of a Basic Authorization configuration file:
plugin: prometheus
config:
targets:
- http://localhost:9100/metrics
authorization:
type: basic
username: <user>
password: <password>
Example of a Bearer token configuration file:
plugin: prometheus
config:
targets:
- http://localhost:9100/metrics
authorization:
type: bearer
token: <token>
API
Okmeter has built-in limited support for Prometheus-like Query API. Currently, there are two types of queries supported: query and query_range.
You can use Okmeter as a Datasource for your Grafana installation. To do so, add a new Datasource of the Prometheus type with the following settings:
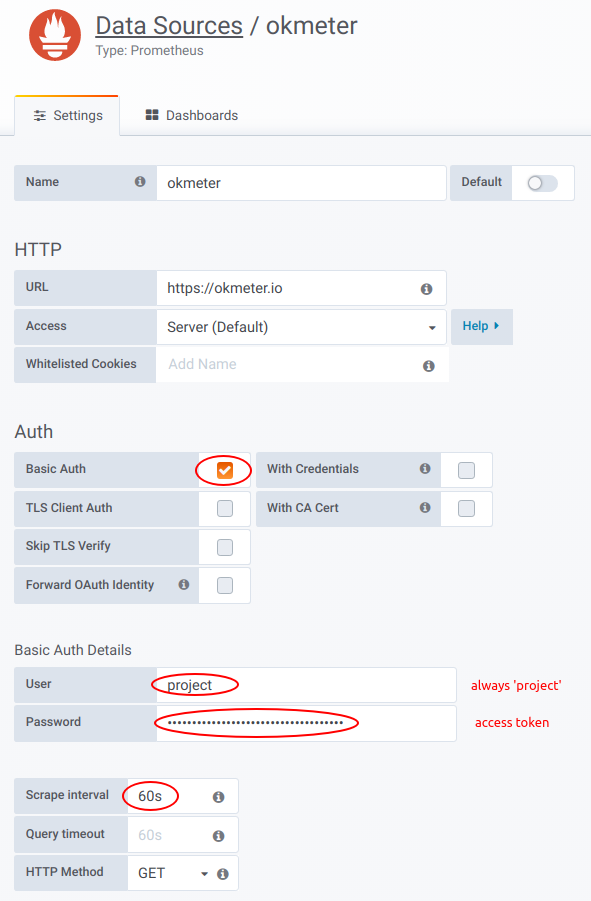
The Basic Auth Password is the project's access token. Please remember to set the Scrape interval to 60s.
Once set, this Datasource can be used to retrieve data from Okmeter.
Note that Okmeter does not support PromQL query language at the moment. Only the native query language Okmeter Query Language is supported.

Query Language
Lines expression syntax:
lines: - expression:
metric(a='b', c='d*', e=['f', 'g*'])#example some load averages- select all metrics with labels matching values
a='b'matches metrics with labelaequals fixed string'b'c='d*'matches metrics with labelcstarts with'd'e=['f', 'g*']matches metrics with labeleequals fixed string'f'or starts with'g'lines: - expression:
rate(EXPR)#example python cpu_user- derivative for each metric in
EXPR lines: - expression:
counter_rate(EXPR)#example python cpu_user- derivative for counters – like
ratebut doesn`t spikes for counter reset lines: - expression:
sum(EXPR [, ignore_nan=True|False])#example all python's cpu_user and cpu_system- sum of all metrics in
EXPR - If
ignore_nan=False, then result is NaN if one metric in EXPR was NaN. Default isignore_nan=True lines: - expression:
max(EXPR)- expression:min(EXPR)- expression:std(EXPR)#standard deviation - expression:average(EXPR)#same as mean - expression:mean(EXPR)#example mean load average- at each time-point take aggregation function for all metrics in
EXPR lines: - expression:
sum_by(label_name, [other_label,] EXPR)#example processes cpu usage - expression:max_by(label_name, [other_label,] EXPR)- expression:min_by(label_name, [other_label,] EXPR)- expression:std_by(label_name, [other_label,] EXPR)#standard deviation - expression:mean_by(label_name, [other_label,] EXPR)#same as average - expression:average_by(label_name, [other_label,] EXPR)#example mean load average- group all metrics in
EXPRby value oflabel_namelabel and aggregate metrics in the same group into one metric - Accepts parametr
ignore_nan=False|True, just like ordinarysum lines: - expression:
win_sum(window_size_in_seconds, EXPR)- expression:win_mean(window_size_in_seconds, EXPR)#same as win_avg - expression:win_min(window_size_in_seconds, EXPR)- expression:win_max(window_size_in_seconds, EXPR)- expression:win_std(window_size_in_seconds, EXPR)- expression:win_avg(window_size_in_seconds, EXPR)#example mean load average on hour window- Applies specified function
sum|mean|min|max|stdfor each metric inEXPRon moving time windowwindow_size_in_seconds. See Moving average lines: - expression:
cum_sum(EXPR)#example- Cumulative sum for each metric in
EXPR. lines: - expression:
top(N, EXPR[, include_other=true|false][, by="exp"|"sum"|"max"])#example top 5 processes by CPU - expression:bottom(N, EXPR[, by="exp"|"sum"|"max"])- show top|bottom
Nmetrics fromEXPRbyews|exp(exponentialy weighted sum) orsumormaxin current timespan lines: - expression:
filter_with(EXPR, FILTER_EXPR)#example memory usage of long running processes- filters metrics in
EXPRreturning only those for whichFILTER_EXPRnot zero (or NaN). lines: - expression:
const(v[, label="value", ...])#example- constant metric with value
vand additonal labels for legend lines: - expression:
time()- timestamp from x-axis as y-value
lines: - expression:
from_string("1,2,3,3,2,1,", [,repeat=false] [,sep=' '] [,label="value", ...])#example- construct metric from string like
"1,2,3,3,2,1,", where each number becomes the value of the metric for corresponding minute lines: - expression:
defined(EXPR)#example all processes1if there is data fromEXPRin this time-point or0if there is NaNlines: - expression:
replace(old_val, new_val, EXPR)#example - expression:n2z(EXPR)#shortcut for "replace(nan, 0, EXPR)" - expression:zero_if_none(EXPR)#shortcut for "replace(nan, 0, EXPR)" - expression:z2n(EXPR)#shortcut for "replace(0, nan, EXPR)" - expression:zero_if_negative(EXPR)- expression:none_if_zero(EXPR)#shortcut for "replace(0, nan, EXPR)" - expression:remove_below(EXPR, value)- expression:remove_above(EXPR, value)- expression:clamp_min(EXPR, min)- expression:clamp_max(EXPR, max)- sets
new_valinstead ofold_val lines: - expression:
sum_by(label, [other_label,] metric(..)) / max_by(label, [other_label,] metric(.))- expression:sum_by(label, [other_label,] metric(..)) * sum_by(label, [other_label,] metric(.))- expression:sum_by(label, [other_label,] metric(..)) - min_by(label, [other_label,] metric(.))- if labels for both
sum_byare the same than it evaluates as/*or-for each pair of metrics (one from left and one from rightmetric) lines: - expression:
sum_by(label, [other_label,] metric(..)) / EXPR- expression:min_by(label, [other_label,] metric(..)) * EXPR- expression:max_by(label, [other_label,] metric(..)) - EXPR- Applies
/ EXPR* EXPRor- EXPRfor each metric from leftXXX_by(label, ...)
Lines legend syntax:
lines: - expression: metric(...) legend:
'%s'- for each line show all
label_name:label_valuepairs in legend lines: - expression: metric(...) legend:
'%(label_name)s anything'- for each line show
`label_value` anythingin legend
Colors syntax:
lines: - expression: metric(...) color:
'#81ff22'- expression: metric(...) color:'red'- color is color
lines: - expression: metric(...) colors:
['#80AB00', 'red', 'rgb(127,0,20)', 'hsla(100,10%,20%,0.8)']- will cycle through specified colors
lines: - expression: metric(...) colors:
/regex.*/: '#fff' /regex2/: 'gold'- will match legend to regexes
lines: - expression: metric(...) options: colors:
semaphore#OR colors:semaphore inv- will color all, previously uncolored lines, with a gradient from
redtogreen - or from
greentoredifsemaphore inv
Sorting syntax:
lines: - expression: metric(...) options: sort:
alpha|num- sort all lines by legend in alphabetical or numeric (default) order
lines: - expression: metric(...) options: sort:
['fixed', 'order', 'for', 'legend', 'items']- fixed sort order by item's
legend lines: - expression: metric(...) options: sort: ... order:
DESC- change sort order to descending
Sorting tooltip syntax:
lines: - expression: metric(...) options: tooltip: sort_order:name|-name|value|-value-
Sorting lines in tooltip (no sorting by default):
- in alphabetical(
name|-name). - by values(
value|-value)
- in alphabetical(
Captions:
lines:
- expression: metric(...)
- expression: metric(...)
title: 'some %(label_name)s'- format chart title with labels from all expressions combined
lines:
- expression: metric(...)
- expression: metric(...)
options:
y_title: 'some text'- Y-axis vertical title as plain text
Alerting
Alerts are an essential part of the monitoring system. They inform the user about what is happening in a timely manner.
Configuring alerts in Okmeter consists of two parts: the triggers part (aka alerting rules) is where the rules that determine when a notification is sent are configured. The notifications part defines where the notification is sent.
Okmeter provides you with a large variety of preset triggers. You can also create your own triggers or override pre-configured ones.
We strongly recommend testing changes to triggers or notifications to make sure that notifications are triggered when they are needed. The easiest way to test is to put the trigger into an active state. You can do this for example by changing the threshold value.
Triggers
Below is an example of a trigger. It counts the number of errors in the NGINX access logs:
expression: 'sum(n2z(metric(name="nginx.requests.rate", status="5*")))' threshold: '>= 1' severity: critical message: '5xx nginx %(value).1f per sec' notify_after: 120 resolve_after: 180 notification_config: ops
The following parameters are available for configuring triggers:
expression
Expression describes how to calculate a monitored value.
It consists of a metric selector (metric(name="..", label_foo="..")) and includes a number of mathematical operations.
Please refer to the query language section for more information.
threshold
Threshold is the value against which the trigger value is compared, resulting from the execution of the query specified in expression and the comparison operation. If the condition in the comparison operation is true, the trigger becomes active. The following comparison operations are allowed: <, <=, >, >=.
severity
The trigger's criticality. This field can be critical, warning, and info.
Triggers with the info severity level aren't designed to be sent anywhere.
message
Message contains the text description of the trigger. It will be added to the notification. You can use the formatting language to add request results and labels to this field. For example, to include in the message the specific error code that caused the trigger to fire, modify the standard NGINX trigger as follows:
expression: 'sum_by(status, n2z(metric(name="nginx.requests.rate", status="5*")))' message: '%(status)s nginx %(value).1f per sec'
notify_after / resolve_after
You can use the notify_after and resolve_after parameters to disregard short-term bursts.
notify_after is a delay for sending a notification after the trigger goes to active status. The delay is set in seconds.
resolve_after is a delay between the moment when the condition in threshold ceases to be true and the moment when the trigger switches to the inactive state. This setting allows to avoid "chattering" (influx of the same alerts) when the trigger values are close to the trigger threshold. The delay is set in seconds.
notification_config
This field specifies the channels (see the Notifications section for more info about configuring notification delivery channels) to use for sending the notification. By default, all notifications are delivered via email and sms and no additional configuration is required.
To change the default behavior, create a notification_config named default. You do not have to specify notification config for every trigger since the default notification_config is used for all of them by default.
You don't have to make any notification config at all if you want to be notified by email or sms only.
You can disable notifications for the trigger via notification_config: off.
Notifications
In the general case, notification config may include the following fields:
renotify_interval: 600
notify_resolve: on
oncalls: # email and sms
- admin_1
- admin_2
- boss
slack_url: https://hooks.slack.com/services/XXXX/XXXX/XXXXXXXX
slack_channel: '#ops'
telegram_chat_id: -XXXXXXXX
opsgenie:
api_key: XXXXXXXX-XXXX-XXXX-XXXX-XXXXXXXXXXXX
prometheus:
url: http://HOST:PORT/api/v1/alerts
basic_auth:
username: XXXX
password: XXXX
renotify_interval
Resend notifications if the alert isn't acknowledged or resolved. Expected value is the number of seconds. Notifications (regardless of the value of this field) will stop being sent if the trigger is no longer active or if it is set to acknowledged or resolved.
notify_resolve
Defines whether to send a notification when the trigger has changed its state to inactive.
oncalls
Defines the list of users who will receive notifications. You can specify users' email addresses and phone numbers on the contacts page. The Notification config refers contacts in the oncalls section by the contact Name.
If no notification configs are defined, the alerts will be sent to all users for whom notifications are allowed on the notification_contacts page.
slack
To enable Slack notifications, create an Incoming WebHook in the Slack settings and define the following fields:
slack_url — the address of the WebHook.
slack_channel — the channel where the notifications will be sent.
telegram
Notifications to Telegram can be enabled by adding our @OkmeterBot to your chat or group. Enter the chat ID in the telegram_chat_id field. To determine the telegram_chat_id, run the /chat_id@OkmeterBot command (this command will work only after @OkmeterBot is added to your chat or group).
opsgenie
To push alerts to Opsgenie, create a new API (Rest API over JSON) integration in your opsgenie settings and specify the corresponding API key in the api_key field.
Note: When using the EU Opsgenie instance, you must also add api_url: api.eu.opsgenie.com.
alertmanager
To push alerts to Prometheus Alertmanager, define the following fields in the Prometheus section:
url— the URL address of your Alertmanager.basic auth— the Basic Auth data for your Alertmanager. It is strongly recommended that you always enable Basic Auth when installing Alertmanager.username— your username.password— your password.
Uninstalling Okagent
- Stop the agent process
sudo /etc/init.d/okagent stop, orsudo service okagent stop, orsudo systemctl stop okagent.service && sudo systemctl disable okagent.service
- Remove Okagent files and the init script:
sudo rm -rf /usr/local/okagent /etc/init.d/okagent - Resolve the "no heartbeat" alert
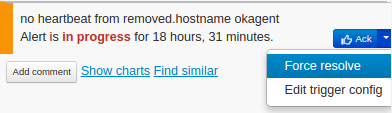
- After three days, the host will be moved to inactive and after 30 days, it will be automatically deleted.
- Done!
Support
Feel free to ask us anything.