Php-fpm monitoring with okmeter
PHP-FPM - it’s a PHP application server.
It accepts FastCGI requests and dispatches them to one of the child php worker processes. It also manages and controls such worker processes for each application or pool.
Okmeter agent will automatically discover every running php-fpm process, will parse and analyse php-fpm config to know about all configured worker pools. Agent then will start gathering metrics from each pool, to help you know and understand what happens with your application at each moment.
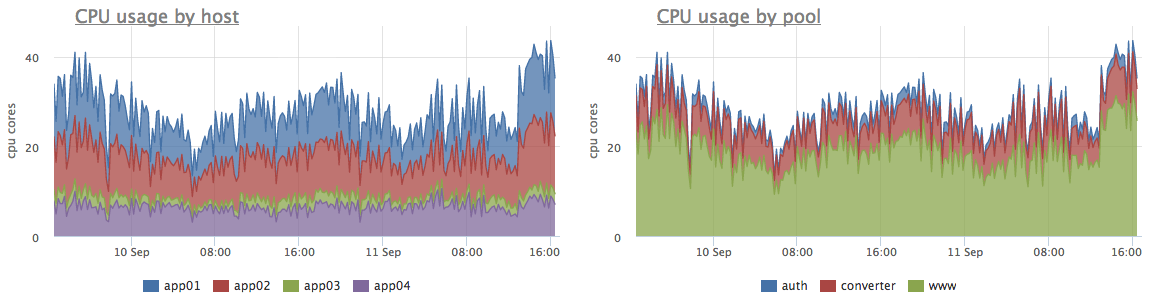
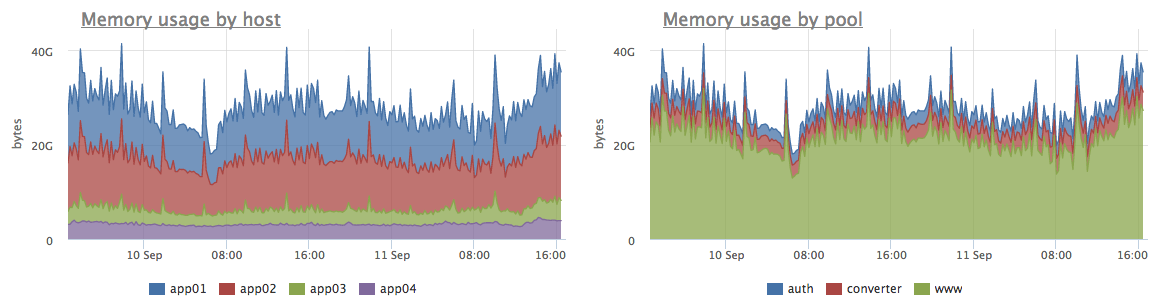
Most of the problems with application performance arise either because of a lack of resources, or because of their excessive consumption. Okmeter agent collects resource usage metrics for each process on a server. That allows to monitor and control your php-fpm application resource usage without any manual integration. You can see overall cluster CPU and memory usage broken down by either server or by worker’s pool:
Okmeter can also collect metrics on internal state of each fpm pool. For that you’ll need to enable fpm’s status page. As soon as it’s enabled okmeter agent will automatically start collecting additional info.
For each configured and running fpm pool agent will collect these metrics:
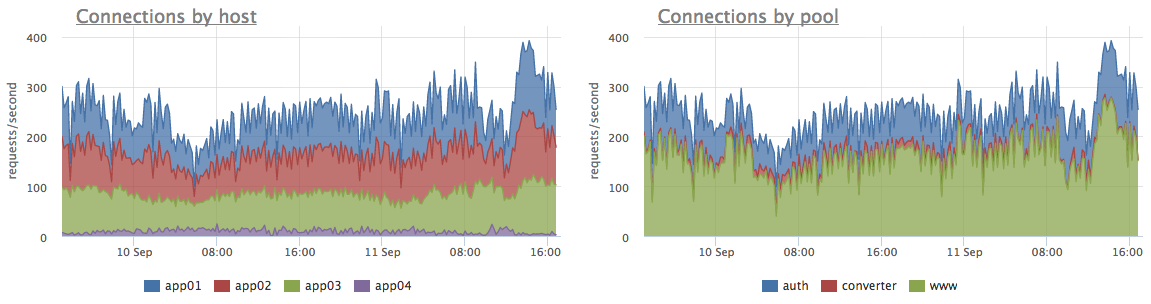
- php_fpm.pool.accepted_connections {pool: “x”, instance: “Y”, source_hostname: “Z”}
-
— the number of requests accepted by the pool since start (taken from `accepted conn` value of status_page). This metrics is useful to control the number of connections arriving per second (if `keep-alive` is not enabled, then it’s equal to request per second).
- php_fpm.pool.processes.count {state: “active|idle”, pool: “x”, instance: “Y”, source_hostname: “Z”}
-
— the number of processes in pool in `idle` or `active` state (from `idle processes` and `active processes` value of status_page). `Active` state means that a process is serving a request right now, while `idle` process is doing nothing and awaiting for new requests.
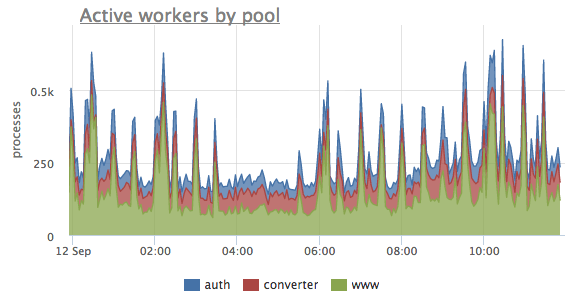 If the number of active php processes will reach the limit (set up by `pm.max_children` config setting), then any new connection will be held waiting for any of those workers to finish their current request and free up.
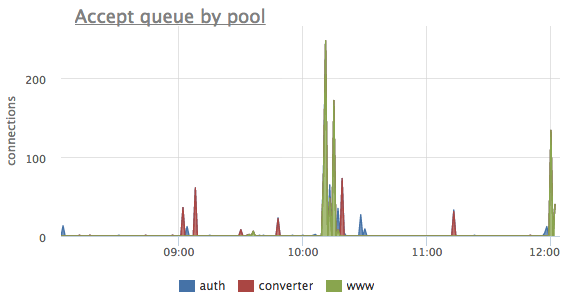
- php_fpm.pool.listen_queue.current {pool: “x”, instance: “Y”, source_hostname: “Z”}
-
— the number of connections awaiting for a worker (from `listen queue len` value of status_page).
- php_fpm.pool.listen_queue.limit {pool: “x”, instance: “Y”, source_hostname: “Z”}
- — the maximum size of the queue (tcp ack backlog) for each pool. Whenever that limit is reached by connections in the queue, all new connections will be either ignored or reset, depending on `sysctl` setting `net.ipv4.tcp_abort_on_overflow`.
- php_fpm.pool.uptime {pool: “x”, instance: “Y”, source_hostname: “Z”}
- — the number of seconds elapsed from the pool’s start (from `start since` value of status_page). That metric is quite useful to catch php-fpm’s restarts, as after reconfiguring or new application version deployment.
Because you can setup many php-fpm pools and processes on one server (and it’s even more so with containers), all collected metrics besides `source_hostname` and `pool` label have also `instance` label, which will contain either the name of each pool’s config file, or - in case of using containers - the name of the container and config file path, like `container_name:/path/to/pool.conf` for example.