Process monitoring with okmeter
Okmeter will collect all your server’s resource usage metrics. But it’s not just that, okmeter will as well report details about each processes resource usage! That allows you to see and know exactly what’s happening on your servers right now and back in time.
As processes might start and finish on unbelievable rate, okmeter agent tackles it with grouping processes by process name, username and container name (if a process is ran within a container). For each of those group agent summarizes resource usage metrics and reports those aggregates. Each metric has a source_hostname label, which identifies the host where the agent and the process is running. But also each process metric has these labels as well:
process— holds process nameusername— holds the name of a user that started that processcontainer— either the container name for containerized processes or a special “~host” value, if the process is running on the host server outside of any container
Okmeter agent successively works with docker containers as well as lxc or kubernetes and other.
For each of described process groups okagent (it’s a short for “okmeter agent”) will collect the CPU time utilized by all of processes in the group:
- process.cpu.user{process:”X”, username: “U”, container: “C”}
- — time spent by process in the userspace.
- process.cpu.system{process:”X”, username: “U”, container: “C”}
-
— time spent by process while awaiting on systems calls.
These metrics are very useful to track which processes are generating load on some server:
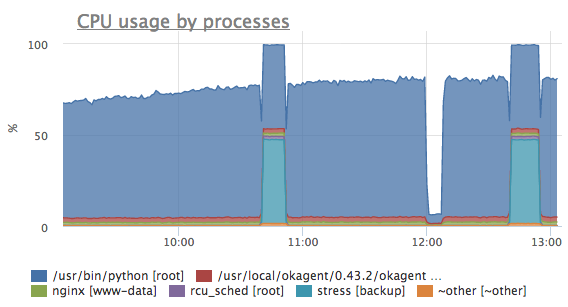
Here the we can distinguish processes ran by different users by the
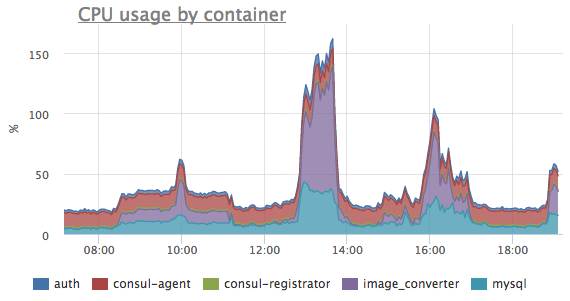
[username]label formated in square brackets.But you can view an aggregated across some or all of your servers chart as well. And, for example, you can get the sum of CPU usage of all the containers on different servers:
But sometimes it’s not only about CPU!
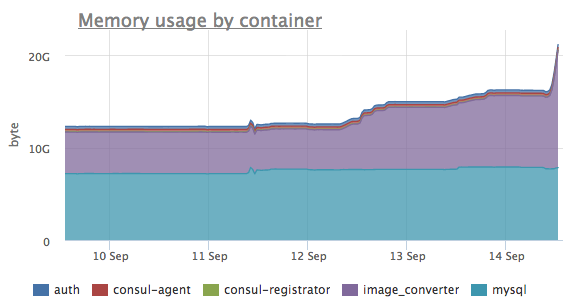
- process.mem.rss{process:”X”, username: “U”, container: “C”}
-
It’s a metric reporting resident set size of a process — the amount of main memory occupied by the process. It allows not only find top processes by memory used, but also one can detect memory leakage, like here we can see the image_converter process tends to eat more a more memory:
- process.mem.swap{process:”X”, username: “U”, container: “C”}
-
— it’s swap usage by corresponding process group.
It’ might not be a problem if some process uses some swap, because it might be rarely accessed pages got swapped out by OS. But sometimes it’s very important to see which processes are actively using the swap, because it might correlate with performance issues. It can be done by looking at a derivative from swap usage — just a rate of an actual swap usage. It will clearly show if some processes are being swapped in or out:
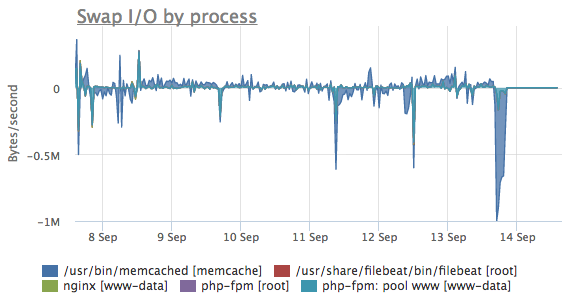
With okmeter you will be prepared for that: there’s a preconfigured auto-trigger that will fire up if it sees any process on any server with swap rate more than 1MB/s. It won’t page you or even alert — it’s just an info trigger, that will work as a hint and help you investigate any performance problem on hand quickier.
Here’s the list of all other process metrics that okmeter will collect:
- process.proc_count{process:”X”, username: “U”, container: “C”}
- — is just number of processes in a process group.
- process.thread_count{process:”X”, username: “U”, container: “C”}
- — a total number of all threads in a process group as a sum of threads of all processes.
- process.disk.ops.read{process:”X”, username: “U”, container: “C”}
- — a number of disk read operations, performed by a process group.
- process.disk.ops.write{process:”X”, username: “U”, container: “C”}
- — a number of disk write operations, performed by a process group.
- process.disk.bytes.read{process:”X”, username: “U”, container: “C”}
- — total number of bytes read by processes in a group:
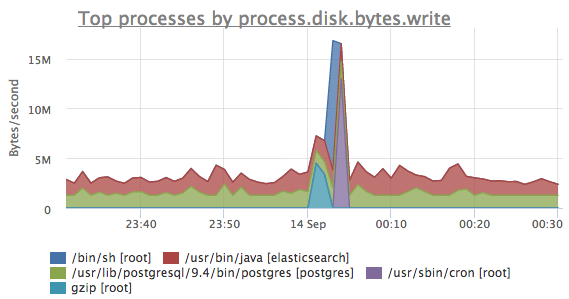
- process.disk.bytes.write{process:”X”, username: “U”, container: “C”}
-
— total number of bytes written by processes in a group:
- process.open_files.count{process:”X”, username: “U”, container: “C”}
- — a number of all open file descriptors as a sum from all processes in a group.
- process.open_files.max_usage_percent{process:”X”, username: “U”, container: “C”}
-
— percentage of open files in relation to
ulimit -n— counted as a maximum percentage from all processes in a group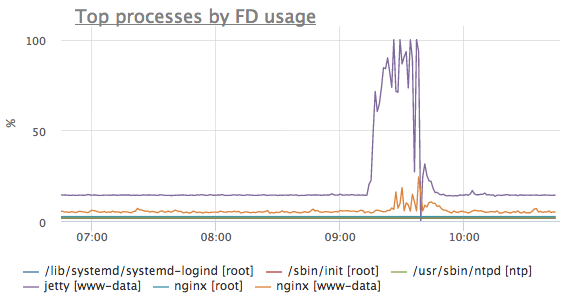
It’s important to track open files usage percent because it might help to prevent some problems. If you application server or any other service will exhaust its file limit and try to create or accept additional tcp connection, the process of this service will get error from system — “too many open files”! This might cause denial of service for some of your clients or something like that. Okmeter helps to anticipate that because with our pre-configured auto-triggers you will be notified whenever any service on any of your servers will begin to come near the limit of its open files. And you’ll be able to handle either by increasing ulimit or by investigation the origin of additional files.
- process.max_cpu_percent_per_thread{process:”X”, username: “U”, container: “C”}
- — it’s a metric showing a maximum of one thread CPU usage percent. That allows to catch the problematic case where, for example, some single-threaded service utilizes 100% of one CPU-core time. And due to a single-threaded nature it won’t be able to scale on adjacent cores, thus it will start to perform worse while not actually utilizing the server resources in full. For example, for such applications and services as redis-server, pgbouncer, nginx worker — hitting such an obscure limit they will simply start to respond to requests and queries with additional latency. And with okmeter you’re prepared to that!
- process.uptime{process:”X”, username: “U”, container: “C”}
- — this metric reports a maximum process uptime across all process in a group. This is useful to detect services restarts, for example, when someone changes configs or deploys a new version.
All these metrics will be gathered, aggregated and reported by okmeter agent automatically, without any configuration.
As you can see, such level of detalization and coverage of all aspects of process execution and performance allows to see the full picture. With historical view you’ll be prepared to investigate the root cause of any occurring problem!