Nginx monitoring with okmeter
If you’re using nginx on your servers okmeter will help you to have an overall view of what’s happening with you web-applications.
Once installed you your servers okmeter agent will automatically detect running nginx. Our agent will find, read and analyze nginx’s config files. It will detect all the access.log’s locations and formats, and it will start constantly analyzing these logs, to provide you with an overall and detailed view of your web-app performance and behaviour.
Sometimes configured log format might lack some info for proper and useful monitoring. If that’s the case, okmeter agent will detect such log format and okmeter will create a special configurational alert, stating that you need to add some log variables into it. These log format variables (when present) allows okmeter to show you the complete picture of your app’s performance:
- $request
- $time_local or $msec
- $status
- $request_time
- $upstream_response_time
- $bytes_sent
- $cache_status
- $upstream_cache_status
While default log format (“combined” in terms of nginx) contains some of those, it still lacks couple very useful ones. Okmeter will prompt you to add them into any log format used:
- $request_time — request processing time in seconds with a milliseconds resolution; time elapsed between the first bytes were read from the client and the log write after the last bytes were sent to the client
- $upstream_response_time — holds a value of time spent on receiving the response from the upstream server; the time is kept in seconds with millisecond resolution. Times of several responses are separated by commas and colons.
- $upstream_cache_status — holds a status of accessing a response cache (0.8.3). The status can be either MISS, BYPASS, EXPIRED, STALE, UPDATING, REVALIDATED, or HIT.
Every log file (of which there may be several) will be read, parsed and analyzed independently, and resulting performance metrics will be generated for each log file and annotated with corresponding log filename in an file metric label.
Okmeter agent will also try to create a detailed performance picture for each different urls used in your web-app. But because there might be unlimited number of urls, our agent tries to group them by similarity. It will try to do it’s best and annotate resulting metrics with an url label, which will contain either the actual url path of some requests, or a special “group url” where some parts of url path are replaced with placeholder. Like, /article/123 will be shown as /article/$id. Also it’s worth noting that okagent will keep track of only limited number of urls, and that’s why it will put everything else into a special ~other url, in case there’s too many different urls.
Though the metrics, that okmeter agent is collecting, might look very simple, they are indeed quite useful because they are “sliced” into different “dimensions”. Any metric has corresponding annotations or labels that might have different values. Like for example
nginx.requests.rate — which is simply the number of served requests per second.
But if you slice them, you’ll get a totally different level of details. Like, here we have
nginx.requests.rate{file:"mydomain.com.access.log", method:"GET", status:"200", url="/login"} — the number of GET requests to “/login” on “mydomain.com” served with “200 OK” status.
While this one
nginx.requests.rate{file:"mydomain.com.access.log", method:"POST", status:"500", url="/login"} — the number of POSTs to “/login” that got “500 internal server error” as a result.
One can use these (url, method, status, etc) labels to drill-down into details of system behavior, by filtering, regrouping charts and alerts in these dimensions.
Let’s walk through all of the metrics, with some usage examples! We’ve already looked at
- nginx.requests.rate {file:“X“, method: “M“, status: “YYY“, cache_status: “X“, url: “U“ }
-
— It is just current request rate. That metric besides file, method, status, and url has also cache_status label, which indicates the status of accessing a response cache, and originates from $upstream_cache_status log variable.
From that metric Okmeter can produce charts with different filters and grouping settings:
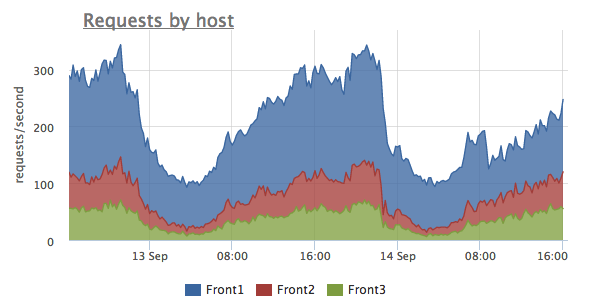 This chart shows total request rate and it distribution between different servers. One can see that here Front1 server gets about two times more requests than other two servers. It might be the case of improper load balancing or something like that.
Let’s see another chart rendered on the same data:
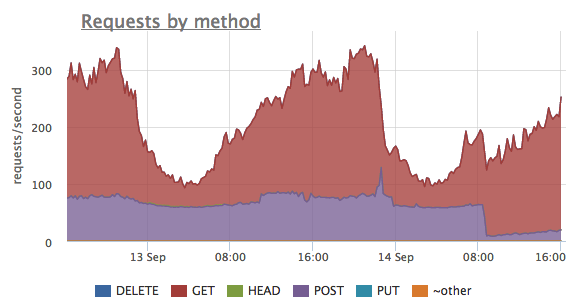 The same metrics — nginx.requests.rate — grouped here by different HTTP methods. We can see that up until some point there were a lot of POST requests, but after that the number dropped. All that while the number of GET requests varies differently.
Another view:
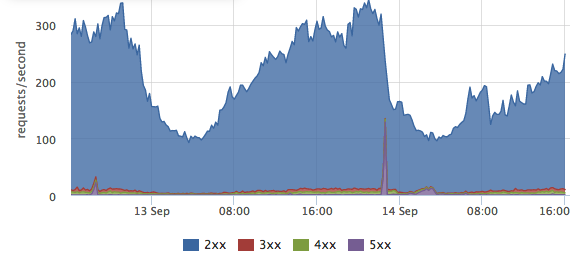 Each
Each nginx.requests.ratemetric is annotated with a “status” label, that holds the value of HTTP status of a server response. Grouping these metrics by that label allows us to see success response percentage as a ratio of the number of HTTP 2xx’s responses to everything else — HTTP 3xx redirects, HTTP 4xx client errors and HTTP 5xx server errors.Let’s dig deeper!
We can filter out everything but HTTP 5xx server errors and inspect the distribution between different 5xx statuses:
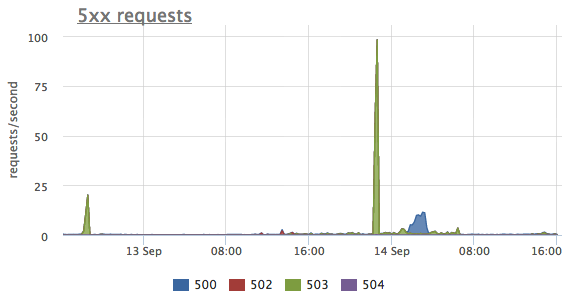 One can’t see tree spikes on that chart. And while the first two were with HTTP 503 status, which is “Service unavailable”, the third one is different, it’s 500 — “Internal server error”.
Neat thing is that we can correlate different views and labels one to another:
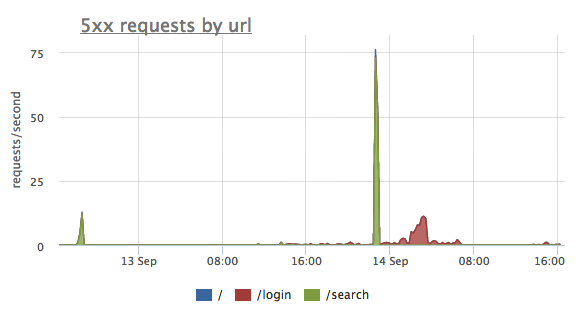 Here we grouped the same HTTP 5xx errors not by HTTP status but by URL label this time. And now it’s perfectly clear that the first two spikes of errors were on the "/search" endpoint, and the third one was "/login" problem.
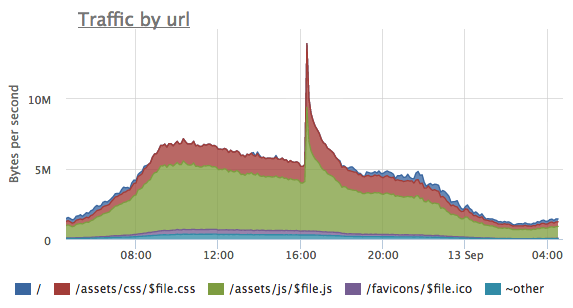
- nginx.traffic.rate {file: “X“, url=“U“ }
-
— total outbound traffic, calculated as the number of bytes sent to a client. Okmeter get’s that either from $bytes_sent or from $body_bytes_sent nginx access log variables.
That metric is useful to get a sense of which URL’s are responsible for the most of the traffic. It’s very convenient to watch changes in traffic profile, for example, for optimisation of static content of your website, or after changing caching policies or cache invalidating during a release of a new version of static assets:
- nginx.response_time.histogram {file: “X“, method: “M“, status: “YYY“, cache_status: “X“, url: “U“, level: “L“ }
-
— for each set of
file,method,status,cache_statusandurlcontains a histogram of a server response timings for specific period of time.Histogram is represented as a rate of requests per second, which response times fall into preset timing ranges. A value of the
levellabel is a corresponding coded response timing range. For example, if the value of a metricnginx.response_time.histogram{method:"GET", status:"200", url="/", level="[-inf 0.5]"}at some point is equal 1, it means that at this point in time there were 1 “GET /” request per second, that ended up beeing served within 0 to 500 ms. - nginx.upstream_response_time.histogram {file: “X“, method: “M“, status: “YYY“, cache_status: “X“, url: “U“, level: “L“ }
-
- but it’s backend (or upstream in nginx’es terms) response time. It might differ from
$request_timebecause$upstream_response_timedoesn’t include the time it took for nginx to send the response back to a client, only the time it took for a upstream backend server to send response to nginx. While$request_timemetric includes both.
One more of such kind of histograms is
These histograms allow very intuitive detection of whether your system is behaving as usual or not so. As you can see on the response time histogram chart below, green area represents the number of requests that were served under 500ms, while yellow shows those served for more that 500ms but less than 1 second. And the red — slowliest ones — it took server a full second or more to respond:
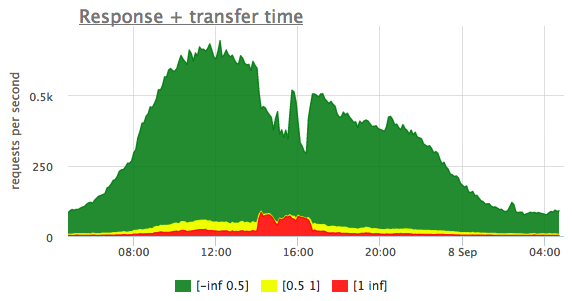
It’s obvious that at some point around 2pm there were some kind of outage, and a lot of responses became slow. And it lasted up until ~ 5pm.
If we correlate that to corresponding upstream_response_time histogram chart, it becomes very clear that the problem was in the backend servers — they were lagging for some reason, and it wasn’t just a network problem, as one might’ve thought.
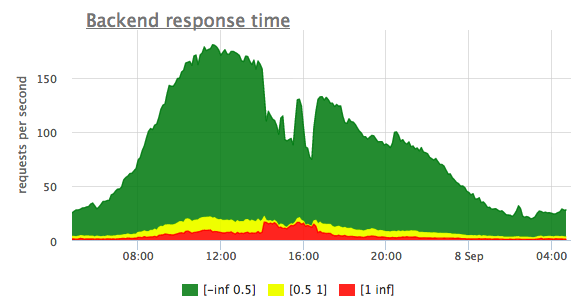
Also if you compare the total number or request (Y-axis values) on these two chart, you’ll find that they don’t match. Not all user requests go through to backend servers. The thing is that some of the requests nginx is able to serve itself without consecutive request to backend at all, like for example, static assets from files or some cached dynamic web pages.
All the listed nginx metrics, gathered from access log files, allows to accurately assess how good your website performance is (in terms of errors and response latencies) from the real traffic and all the real user requests, and not on some synthetic load profile or sampling requests.
This shows you a complete picture of what’s happening or were happening at any point in the past. An ultimate transparent visibility of such kind allows to stay on top of everything and to act not blindly, but with a good understanding of the situation.