PgBouncer monitoring with okmeter
Okmeter collects and reports full set of metrics on all aspects of PgBouncer operation. That gives you a complete picture of Postgres database performance from client's point of view and enables you to easily understand root causes of any issues with PgBouncer or Postgres functioning.
Okmeter helps to stay on top of everything happening with PgBouncer / Postgres.
Okmeter automatically gathers operational data and statistics about:
PgBouncer Auto-discovery
Okmeter agent will automatically detect a PgBouncer instance running on a server or in a container. For every PgBouncer process found on a server okmeter agent will gather all needed operational metrics.
Query execution and transaction monitoring
Workload monitoring is the cornerstone of any monitoring. PgBouncer's job is to proxy queries to a DB, so query monitoring is the most crucial part of DB monitoring.
Problems with query processing usually show themselves in a manner of:
- Either query processing durations change, i.e. increase in query execution time is a sure sign of problems.
- Or as query / transaction throughput — a sudden decrease of queries per second might indicate a problem.
Our monitoring agent periodically runs SHOW STATS; command against PgBouncer instance and reports it on a dashboard with these metrics and charts:
- pgbouncer.total_requests {database: "D", instance: “Y”, source_hostname: “Z”}
-
Total number of SQL queries proxied (or "pooled" as they say) by pgbouncer. Also known in modern pgbouncer versions as total_query_count.
This metric allow easily spot a sudden change in usual Postgres / PgBouncer load profile: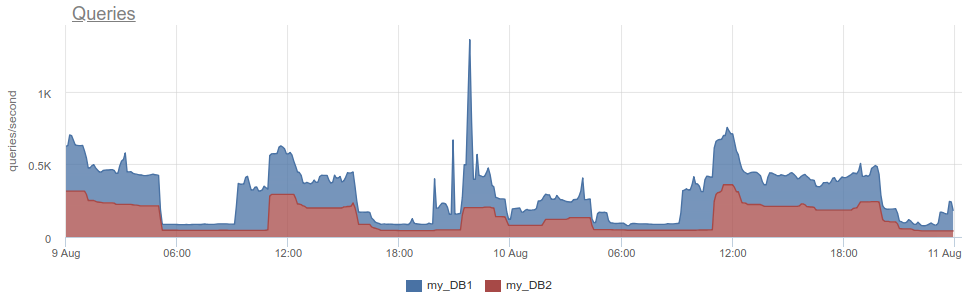
- pgbouncer.total_query_time {database: "D", instance: “Y”, source_hostname: “Z”}
-
Total number of seconds spent by pgbouncer when actively executing queries connected to PostgreSQL.
Note that it's in seconds, not microseconds as in pgbouncer's SHOW STATS output.
On a chart with a ratio of total_query_time / total_requests we will get a clear picture of average query duration: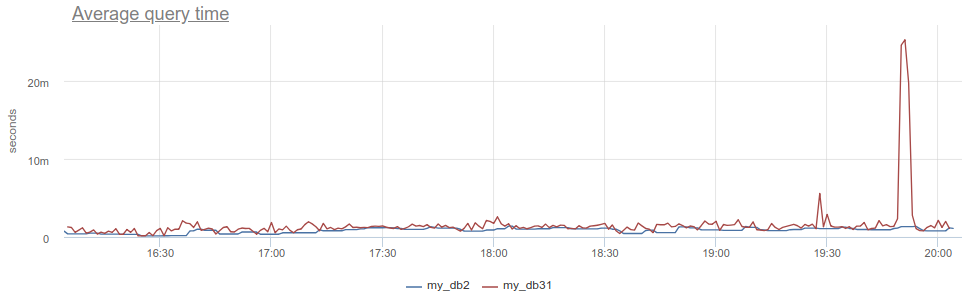
- pgbouncer.total_xact {database: "D", instance: “Y”, source_hostname: “Z”}
-
Total number of SQL transactions proxied (or as the doc says "pooled") by pgbouncer into a specific database.
You can not only chart it as is, but also get a chart of average number of SQL queries per transaction by dividingtotal_requests / total_xact. This will allow to spot anomalies in transaction profile: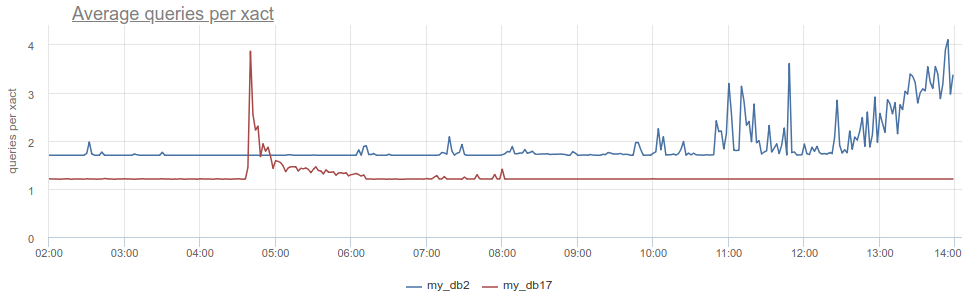
- pgbouncer.total_xact_time {database: "D", instance: “Y”, source_hostname: “Z”}
-
Total number of seconds spent by pgbouncer when connected to PostgreSQL in a transaction, either executing queries or in idle in transaction state.
Together with total_query_time this metric allows to estimate the percentage of time that PgBouncer's server connections are idling while being in transaction. One can get that as1 - total_query_time / total_xact_time: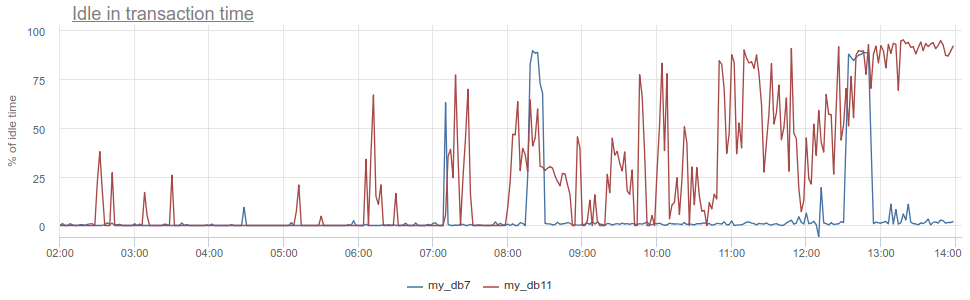
- pgbouncer.total_wait_time {database: "D", instance: “Y”, source_hostname: “Z”}
-
Time in seconds spent by clients waiting for a server connection to the database D. This metric is avalable since PgBouncer 1.8.
This will show if database performance degradation from client's point of view was due to a corresponding PgBouncer pool is exhausted, so one can try to tune its size with pool_size or max_db_connections settings: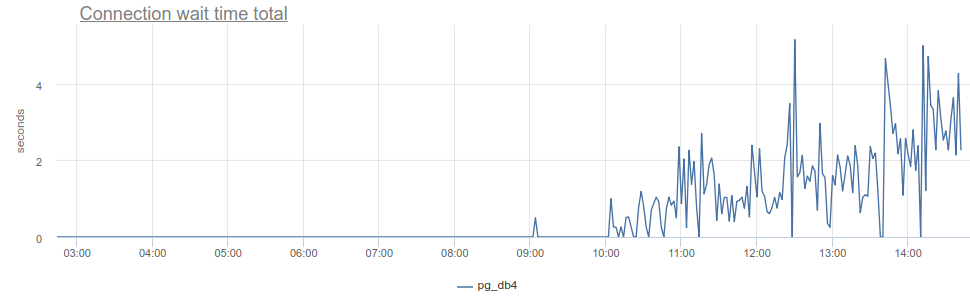
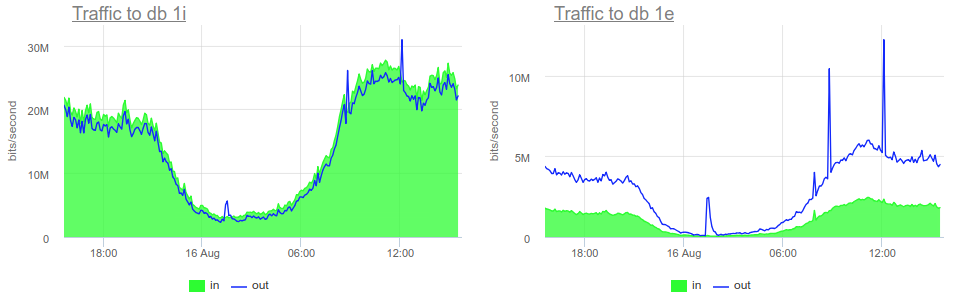
- pgbouncer.total_received {database: "D", instance: “Y”, source_hostname: “Z”}
- pgbouncer.total_sent {database: "D", instance: “Y”, source_hostname: “Z”}
-
Total volume in bytes of network traffic received and sent by pgbouncer to each database:
PgBouncer server connections monitoring
Okmeter agent periodically executes SHOW POOL against a special virtual administrative pgbouncer database.
For each PgBouncer instance okmeter reports its operational stats on a dashboard with these metrics and charts:
- pgbouncer.server_connections.count {database: "D", user: "U", state: "S", instance: “Y”, source_hostname: “Z”}
-
Current number of open Server connections (i.e. from PgBouncer to Postgresql) to different databases (tagged as database label) from different users in different states according to
SHOW POOLSsv_ fields — sv_active, sv_idle, sv_used, sv_tested and sv_login.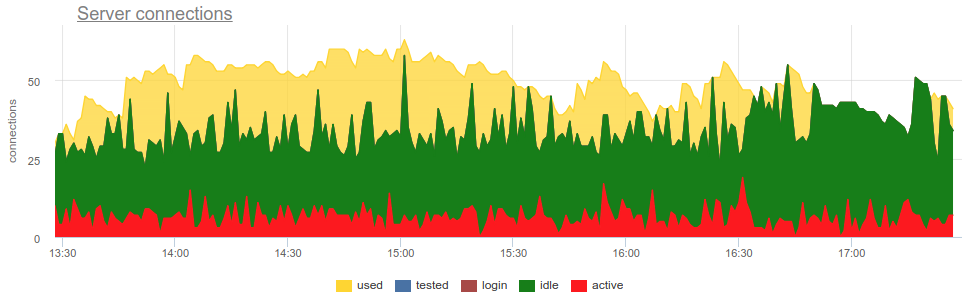
- active — number of Server connections that are linked to a client. Depending on pool_mode within that connection either a transaction is in progress or an SQL query is executing, or, in case of pool_mode = session it might be idling without open transactions.
- idle — number of Server connections that are unused right now and are immediately usable for client queries.
- login — Server connections that are currently logging / authorizing in a database.
- used — Server connections that have been idle more than server_check_delay (which is 30 seconds by default), so they need to be checked with server_check_query before they can be used.
- tested — Server connections that are currently running either server_reset_query after being used by some client and before being avalable to a new one. Or running server_check_query after being in used/SV_USED state.
PgBouncer client's connections monitoring
Okmeter monitoring agent repeatedly runs SHOW CLIENTS; on PgBouncer and gathers that:
- pgbouncer.clients.count {database: "D", user: "U", client_address: "A", state: "S", instance: “Y”, source_hostname: “Z”}
-
Current number of client's connections from different users and IP addresses (tagged as client_address label) to different databases in different states.
This metric not only allows to see how many connections were opened to a particular database as a particular user, but having client_address label allow to see connection origin IP address. Which is super handy when investigating an abnormal behavior of some application instances, like here, for example: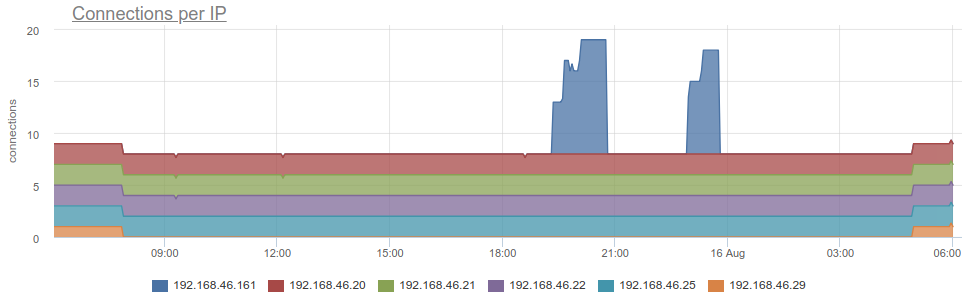 Or, if on Average Query Time chart you identify a performance degradation as here:
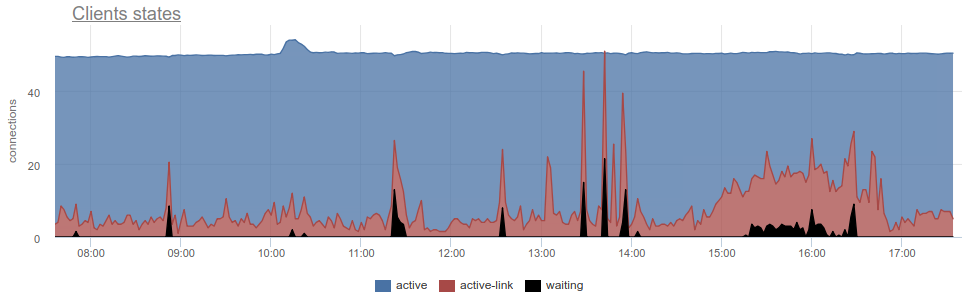
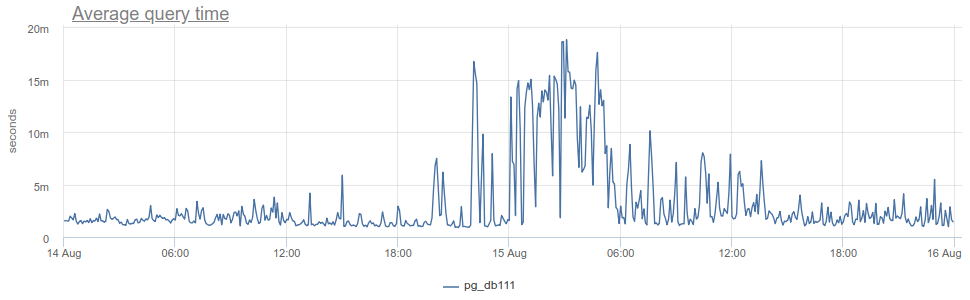 You can not only see that there was a surge of client connections, but with okmeter you'll get a picture of these connections states:
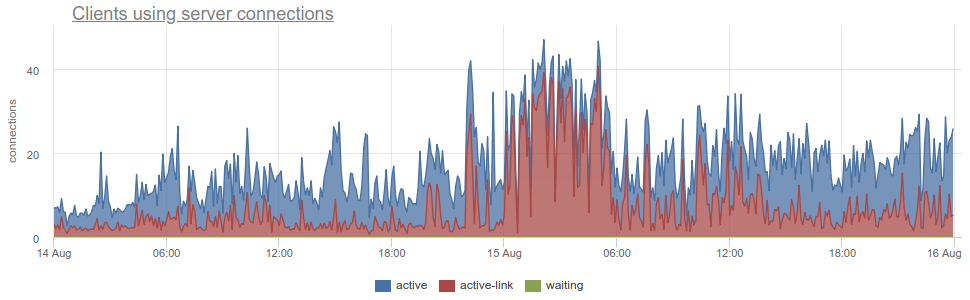
- active — established client connections.
- active-link — client connections linked with server connections, i.e. a client session got an actual Postgres connection from a pool for this moment, and probably is executing a query within it.
- waiting — client connections that have sent queries, but have not yet got a server connection. And are waiting to be linked with either a connection in a pool released/freed by another client or for newly established by pgbouncer server connection if pool's limits allow that.
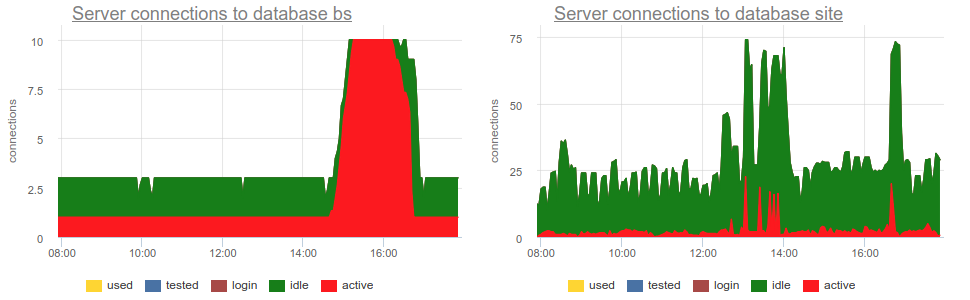
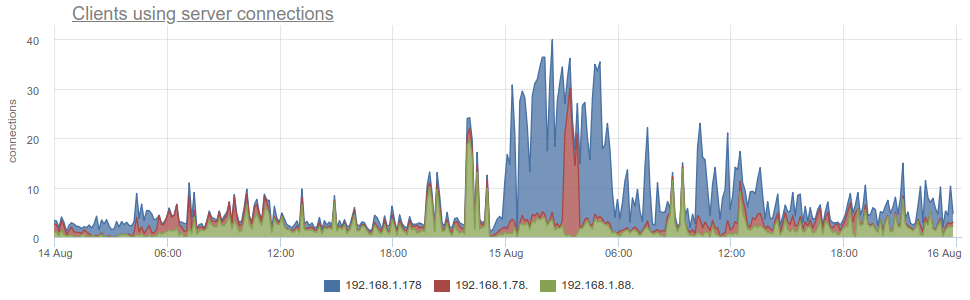 Or, for example, in a case of database connection pool limit exhaustion, you'll see client connections in waiting state, i.e. awaiting a free server connection to be linked with:
 This is definetelly might cause problems to overall performance of your system. But thanks to okmeter's built-in auto-triggers, you'll be notified whenever this happens.
And with detailed metrics on waiting clients you'll be able to easily pinpoint which databases/clients are suffering these waits: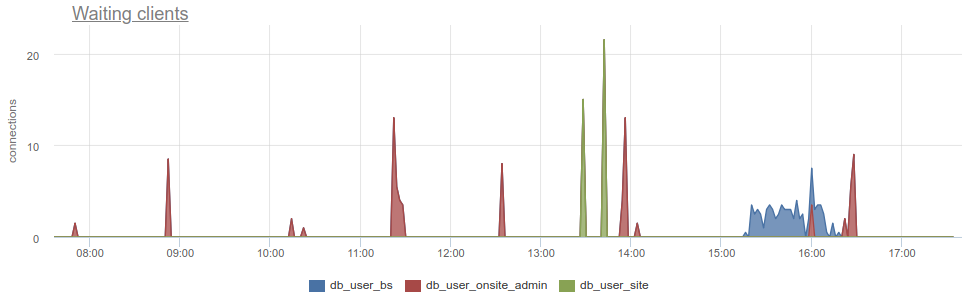
And there's more!
This is only a part of what okmeter.io helps with. It will not only show you detailed charts of all the connections and query processing. Okmeter also notifies when something goes wrong with a DB, because of a built-in base of configured by experts auto-triggers.
Also okmeter knows everything about Postgres monitoring, and will help you navigate in Postgres operations as well.
With okmeter monitoring you'll be prepared to any trouble with PgBouncer and Postgresql.