Sphinx monitoring with okmeter
Sphinx is an open source full text search server.
Okmeter will monitor your Sphinx installation and will help you be be aware of its status and performance.
Whenever okmeter agent sees an Sphinx running on a server, it will automatically define connection parameters and will collect detailed performance metrics. Here’s what agent will gather:
- sphinx.query.count {query_type: “local|distributed”, instance: “Y”, source_hostname: “Z”}
-
— a count of server queries with regard to query type -
localordistributed. Charted, these metrics allow to easily estimate cluster wide distribution of queries, ratio of local and distributed queries and see sudden spikes in Sphinx usage: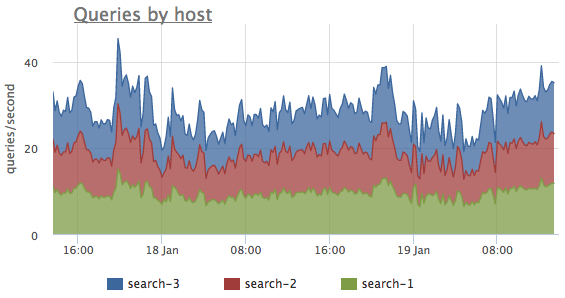
- sphinx.query.total_time {query_type: “local|distributed”, instance: “Y”, source_hostname: “Z”}
-
— it’s a cumulative sum of time spent serving requests, again by local / distributed type. A chart of that metric derivative shows which Sphinx instances running on which servers are the most loaded. If all the indexes fit into RAM, searchd (which is Sphinx daemon process) almost won’t need to access disk, and in that case this
sphinx.query.total_timemetric should be pretty close to the CPU time usage by searchd process, as we can see here: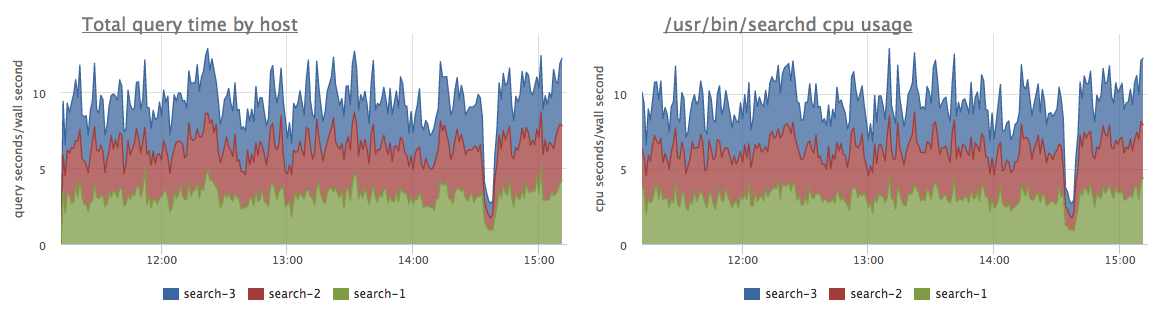 So by difference in those two charts one can easily identify, if searchd has enough RAM for operating on its maximum performance.
If we divide
So by difference in those two charts one can easily identify, if searchd has enough RAM for operating on its maximum performance.
If we divide sphinx.query.total_timederivative bysphinx.query.count, we’ll get a mean query time chart. And it allows to spot performance degradations very well, like here: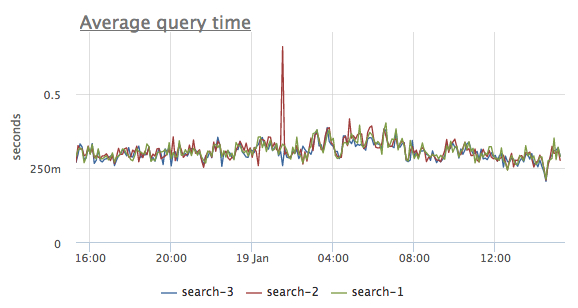
- sphinx.query.time {query_type: “local|distributed”, "stage": "cpu|disk_read|wait", instance: “Y”, source_hostname: “Z”}
-
— is a cumulative sum of time spent in all the different stages of query handling process. For local queries there’s
cpuanddisk_readtimes, which are pretty self-explanatory. While for distributed querieswaittime shows the amount of time spent waiting for remote cluster nodes to respond to query. Those metrics you’ll get if searchd is ran with--iostats --cpustatsoptions (check the docs). These timing metrics are of a great help when one needs to analyse Sphinx resource usage, so one can carry performance optimizations with regards to pinpointed bottleneck. - sphinx.query.disk.ops.read {query_type: “local”, instance: “Y”, source_hostname: “Z”}
-
— that’s a cumulative sum of number of read operations performed by Sphinx while handling requests. To get this metric one should provide
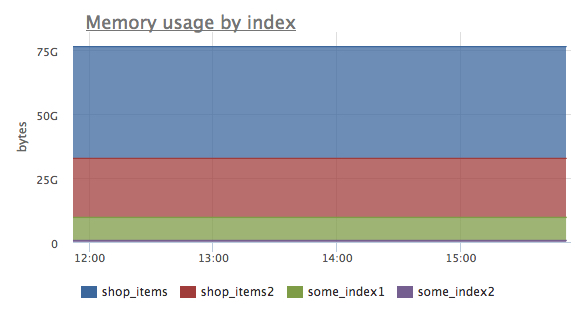
--iostatsoption while invoking searchd (check the docs). That metric allows to evaluate disks performance fitness to the current Sphinx load profile. - sphinx.index.memory.used {index: “x”, instance: “Y”, source_hostname: “Z”}
-
— the volume of memory used by each index. Allows to see which of the indexes occupy most of the memory:
- sphinx.index.disk.used {index: “x”, instance: “Y”, source_hostname: “Z”}
- — the amount of disk space used by each index.
- sphinx.index.documents.count {index: “x”, instance: “Y”, source_hostname: “Z”}
- — the number of documents in each index.
- sphinx.index.documents.bytes {index: “x”, instance: “Y”, source_hostname: “Z”}
- — is a total sum of sizes of all the original documents put in each index.
- sphinx.uptime {instance: “Y”, source_hostname: “Z”}
- — searchd uptime in seconds. With that one can detect Sphinx process restarts if any.
- sphinx.connections.count {instance: “Y”, source_hostname: “Z”}
- — shows the current number of incoming connections to the Sphinx instance Y of server Z.
- sphinx.connections.overflows {instance: “Y”, source_hostname: “Z”}
- — a counter of events, when the limit of concurrent connections to a Sphinx instance was reached. If you see a continuous growth of that counter, that means, that some of the client applications are getting connection errors from the service. In such a case one might consider increasing the limit.
In case one setup many Sphinx daemons to run on one server, and that might be a common case in containerized environment, all collected metrics will be labeled with instance label, which will contain either the IP:PORT pair of a listen socket of the corresponding Spingx process, or — in case of using containers — the corresponding container name. So in any case it will be possible to distinguish different searchd instances.
Okmeter agent will automatically collect all these metrics, and okmeter will provide you with a chart dashboard, so you will get a complete picture of the current Sphinx cluster state and performance.