ZooKeeper monitoring with okmeter
ZooKeeper is a distributed coordination service built as a hierarchical key-value storage. Apache Kafka, Hadoop, ClickHouse and many others services depend on ZooKeeper.
Okmeter will monitor your ZooKeeper and will help you be sure of it's proper operation.
-
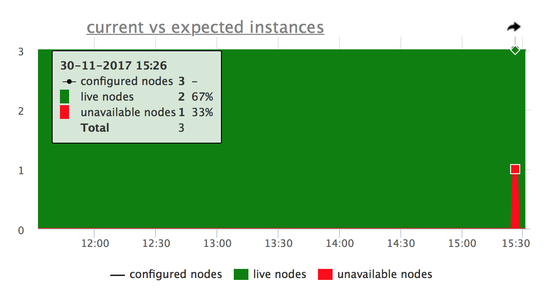
In a production environment for reliability ZooKeeper should be used in a cluster mode, also called "ensemble".
Ensemble relies on availability of enough nodes (quorum) for stable operation and it's crucial to track the number of nodes alive. Okmeter agent will automatically track all the information about cluster/ensemble health: how many nodes are alive and how many are unavailable, etc.
If any ZooKeeper node goes down okmeter will send an alert about this.
 Also Okmeter collects metrics about ZooKeeper configuration. It will track the number of nodes configured on each machine, which is important to monitor, because improper configuration might lead to a dangerous situation of a "split brain". Split brain occurs when there are two "leader" nodes in ZooKeeper cluster simultaneously and it's really bad. Okmeter will for sure send you an alert in that case.
- zookeeper.current_transaction_number.leader|follower
-
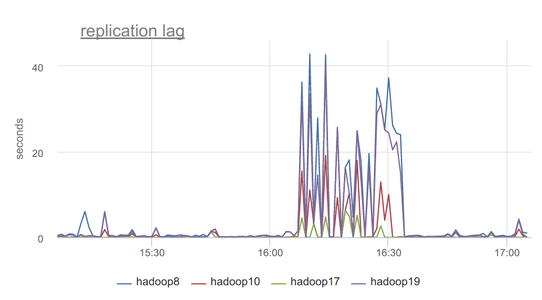
For data safety ZooKeeper uses replication — a leader node sends all the state changes to all other nodes, which are called followers. Because real world networks have latencies and outages, it's important to track an actual current replication lag between the leader and follower nodes. If a follower node constantly lags a little, it's probably ok. But if this lag starts growing, perhaps, one should pay attention. Okmeter will show you that lag for every follower node on a chart like this:
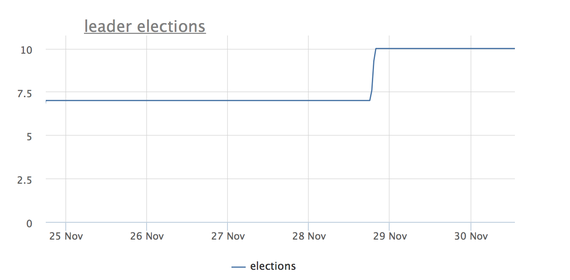
- zookeeper.leader_elections
-
If a leader node becomes unavailable then a leader election process is started. Okmeter automatically tracks the number of elections happened and you’ll be able to see it on a chart like this one:
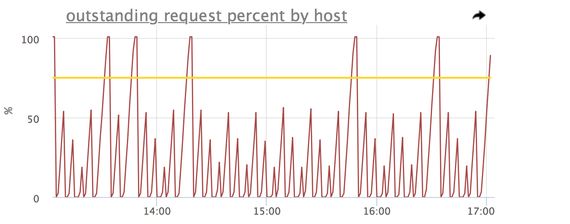
- zookeeper.outstanding_requests {source_hostname:"X"}
-
ZooKeeper is mostly optimized for a read load. If ZooKeeper can't process a request right away, it will be put into outstanding_requests queue, but this queue has a limit. And if it gets full, ZooKeeper will stop processing incoming requests. To prevent such a bad situation, okmeter constantly monitors that and will send you an alert, whenever the queue gets full on 75%
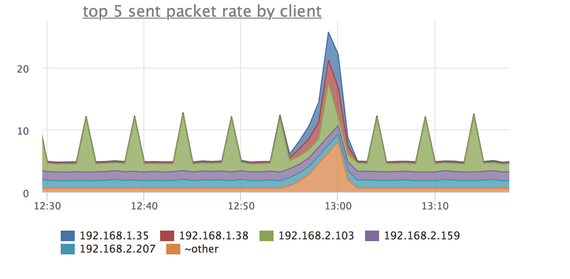
- zookeeper.connection.packets.sent {client_ip:"X"}
-
Okmeter helps figuring out which ZooKeeper client creates most of the write load, by providing a chart like this, showing top 5 clients by the amount of packets sent:
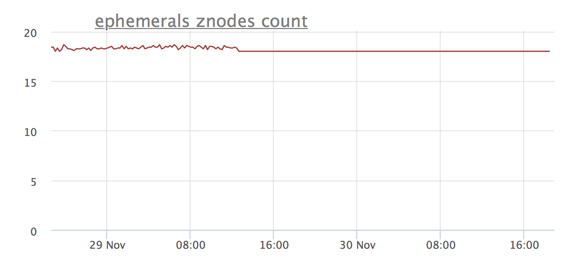
- zookeeper.znodes.ephemerals {source_hostname:"X"}
-
There are so called "ephemeral znodes" in ZooKeeper: these znodes exists as long as the client session of the client created the znode is active. It's used heavily for example for service discovery or cluster membership. If a count of ephemeral znodes suddenly decreases, it might be that the client lost connection or connectivity to ZooKeeper. This chart will help you to always be aware of the current state:
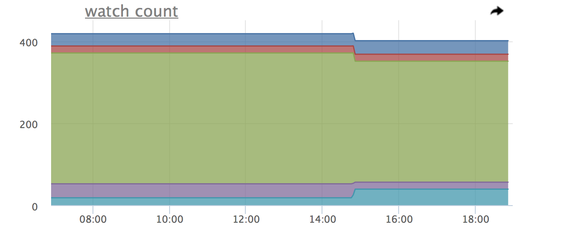
- zookeeper.watchers {source_hostname:"X"}
-
ZK clients can "watch" for changes on selected znodes, that's another mechanism used in tasks, like, cluster membership and service discovery. This chart helps you monitor what is the current situation with ZooKeeper watches across ensemble:
As you can see, Okmeter will show you a pretty full picture of ZooKeeper cluster state, as well as some aspects of ZooKeeper clients behaviour. Okmeter will automatically collect all that info and will show it on a dashboard and will be checking corresponding triggers.