Postgresql monitoring with Okmeter
Okmeter covers with monitoring all subsystems of PostgreSQL — bringing you a complete solution to be aware of all aspects of database performance and enables you to easily investigate any issue with PostgreSQL cluster operation.
Okmeter will help you know what's happening with PostgreSQL at any time.
Okmeter collects and shows detailed PostgreSQL stats on
- Query execution
- Client connections
- Autovacuum
- Background writer and checkpoints
- CPU, memory and disk utilization
- Buffers usage
- Disk usage
- Index scans
- Locks usage
- Table operations
- Transaction processing
PostgreSQL Autodiscovery
Okmeter agent automatically detects PostgreSQL running on a server or in a container.
For every PG instance our agent will discover it and start monitoring it. For gathering internal detailed metrics, it will ask you to create a monitoring user and grant read access to the RDBMS internal system views, like, pg_stat_activity and other pg_stat_* views. Okmeter agent don't need access to any private data stored in DB.
It happens that there might be more than one PG instance running on a server. To differentiate them, in addition to source_hostname label, all the metrics have also an instance label, that will contain IP:PORT of the respected listen socket. Or, in case PostgreSQL is ran inside of container, instance label will represent container name.
Query monitoring
Workload monitoring is the cornerstone of any monitoring. For a DB its job is to serve queries, so query monitoring is the most crucial part of DB monitoring.
Any PostgreSQL query might spend DB resources to:
- read some data from VFS or physical disk drives
- filter, sort, aggregations, and other query processing stages take CPU time
- INSERT/UPDATE queries produce disk write operations
- Some request/query took a lot of the available CPU time, so other queries processing timings sufficiently went up.
- Server resource degradation lead to bad DB performance: CPU frequency decrease due to overheating will affect all database operations.
- Or if there's a problem with BBU in a RAID, it might lead to bad INSERT/UPDATE performance, due to write cache being disabled.
- Other processes on a server might affect PostgreSQL performance due to high resource utilization. That might be a backup process or log rotation or event server administrator actions.
- postgresql.query.time.total {query: “SELECT...”, database: "D", user: "U", instance: “Y”, source_hostname: “Z”}
-
Total time that PostgreSQL cluster spent serving specific (
querylabel) kind of queries. Simply put, it's a sum of disk wait time, computational (CPU) time and locks wait time. - postgresql.query.time.disk_read {query: "Q”, database: "D", user: "U", instance: “Y”, source_hostname: “Z”}
-
Total time that PostgreSQL cluster spent waiting for disk read operations while serving specific (
querylabel) kind of queries. This metric works only with PostgreSQL setting track_io_timing enabled. Check out PostgreSQL docs on the matter. - postgresql.query.time.disk_write {query: “Q”, database: "D", user: "U", instance: “Y”, source_hostname: “Z”}
-
Total time that PostgreSQL cluster spent waiting for disk write operations while serving specific (
querylabel) kind of queries. This metric works only with PostgreSQL setting track_io_timing enabled. Check out PostgreSQL docs on the matter.This metric will usually be showing zero, because PostgreSQL almost always writes data to disks asynchronously from an INSERT/UPDATE request. One should measure disk write load generated by queries in normal operation on the basis of other metrics, such as postgresql.query.blocks.dirtied.
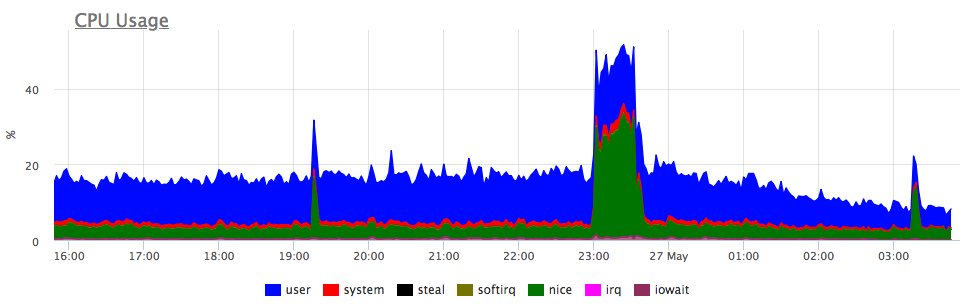
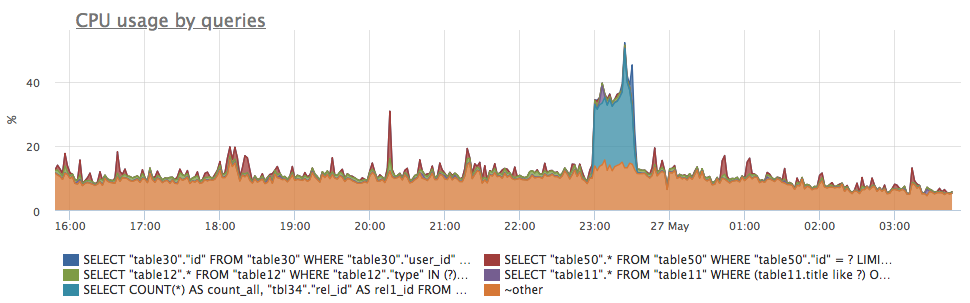
- postgresql.query.time.cpu {query: “Q”, database: "D", user: "U", instance: “Y”, source_hostname: “Z”}
-
CPU time usage estimate for a specific (
querylabel) kind of queries. That metric is only an estimate made under assumption (quite reasonable in many cases) that total time spent by PostgreSQL serving a query is a sum of disk wait time + CPU time. That assumption leads to a considerable error in case of high lock contention or in case of a parallel sequential scan during query execution.This metric allows an easy and fast detection of a root cause of a high CPU usage on a PostgreSQL database server, highlighting a misbehaving query or queries:
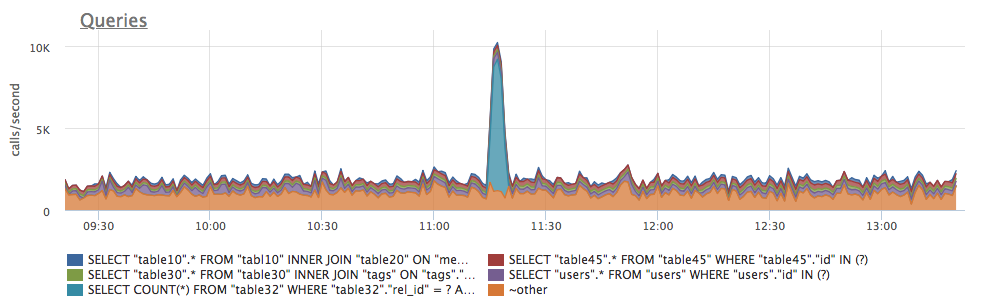
- postgresql.query.calls {query: “Q”, database: "D", user: "U", instance: “Y”, source_hostname: “Z”}
-
Current rate of calls count of a particular query, ran by a particular database user. This metric allows easily investigate sudden changes and anomalies in PostgreSQL database load profile, pinpointing a bad behavior of a query and/or a specific database client — application server or any other database user:
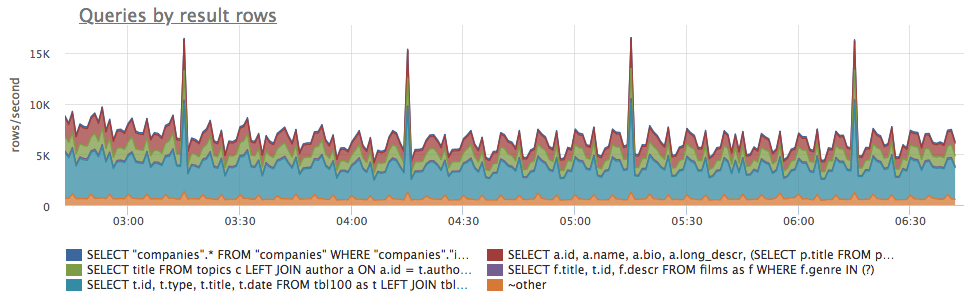
- postgresql.query.rows {query: “Q”, database: "D", user: "U", instance: “Y”, source_hostname: “Z”}
-
Total number of result rows returned by PostgreSQL for a specific query. For INSERT and UPDATE it count the number of rows affected. This metric allow to get an indirect estimate of high-traffic queries:
 By dividing this metrics by the postgresql.query.calls metric:
one gets an average number of rows returned for each query. That allows to spot queries with abnormal amount of results per call, for example in case of forgotten LIMIT clause:metric(name="postgresql.query.rows") / metric(name="postgresql.query.calls")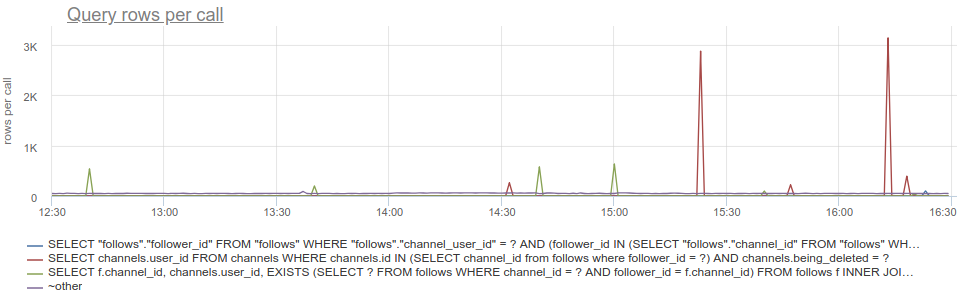
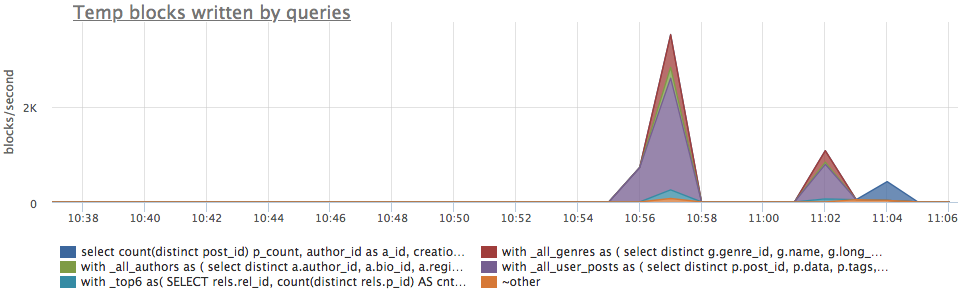
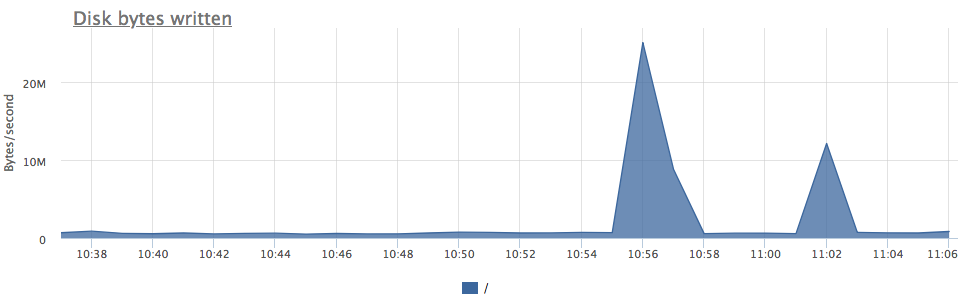
- postgresql.query.temp_blocks.read {query: “Q”, database: "D", user: "U", instance: “Y”, source_hostname: “Z”}
- postgresql.query.temp_blocks.written {query: “Q”, database: "D", user: "U", instance: “Y”, source_hostname: “Z”}
-
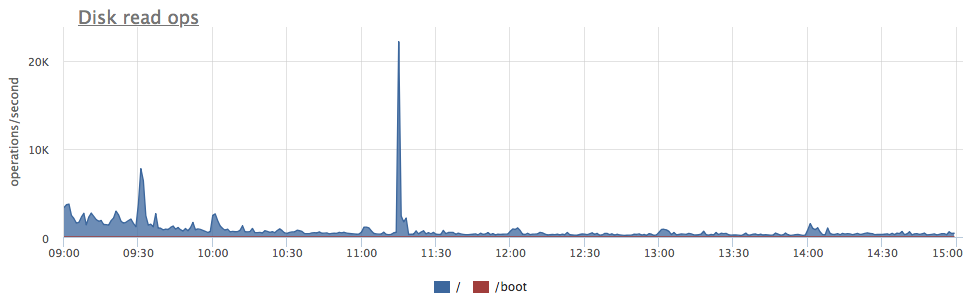
Total amount of temp file blocks read and written by PostgreSQL, while serving specific kind of queries. High value might indicate possible database performance issue. This happens due to PostgreSQL worker, while executing a statement, exhausts work_mem limit, for example because of a big data set needed to be read. This will probably generate high disk IO, like in this case (compare two charts):
- postgresql.query.blocks.hit {query: “Q”, database: "D", user: "U", instance: “Y”, source_hostname: “Z”}
- Total amount of pages/blocks read by a specific query from PostgreSQL buffer cache.
- postgresql.query.blocks.read {query: “Q”, database: "D", user: "U", instance: “Y”, source_hostname: “Z”}
-
Total amount of pages/blocks read by a query from disk, and not from buffer cache.
While it disk read operation from PostgreSQL point of view, this might result in OS page cache hit. In which case it won't be actually read from disks. That's why these metrics might not match closely PostgreSQL process metrics on OS level. Anyhow it's quite useful for finding out queries that resulted in high server disk IO: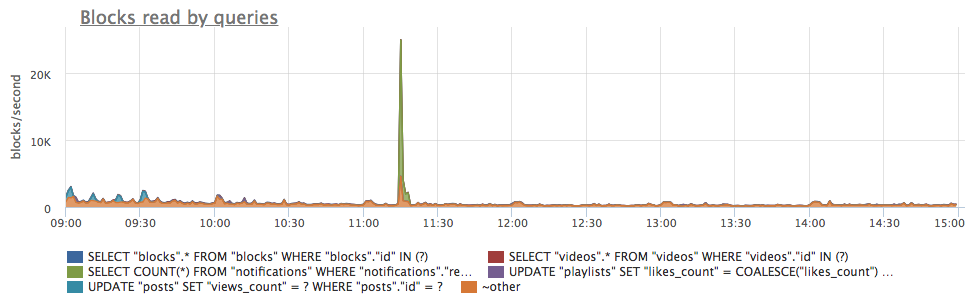
- postgresql.query.blocks.written {query: “Q”, database: "D", user: "U", instance: “Y”, source_hostname: “Z”}
- Number of pages/blocks written to disks while serving specific queries. This metric accounts only for those writes, that were performed synchronously during query execution. Since such synchronous writes are very rare, value of this metric is usually just zero.
- postgresql.query.blocks.dirtied {query: “Q”, database: "D", user: "U", instance: “Y”, source_hostname: “Z”}
-
Number of pages/blocks that were changed (marked as dirty), while serving specific queries. In a normal operation PostgreSQL will write almost all changed data to disk asynchronously, only after successfully executing a query. During query execution it's only WAL that gets written, while changed pages (marked dirty — hence the metric name blocks.dirtied) reside in memory waiting to be synced to disk later, by a special background process — bgwrter.
So while disk write traffic is asynchronous to data change process, one might use blocks dirtied by a query as an estimate of how much background writes will be generated by it. And although actual write profile will probably differ a lot, nevertheless this metric is very handy to find performance affecting queries: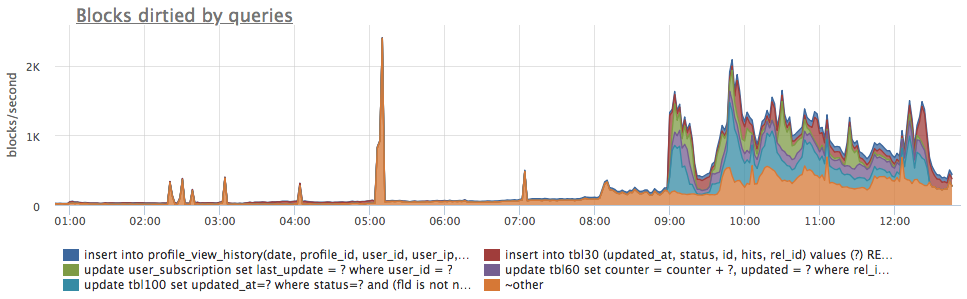
PostgreSQL connections monitoring
- postgresql.connections.count {database: "D", state: "S", client_ip: "IP", instance: “Y”, source_hostname: “Z”}
-
It's a count of all currently open connections from a specific client_ip to a specific database grouped by current connection state:
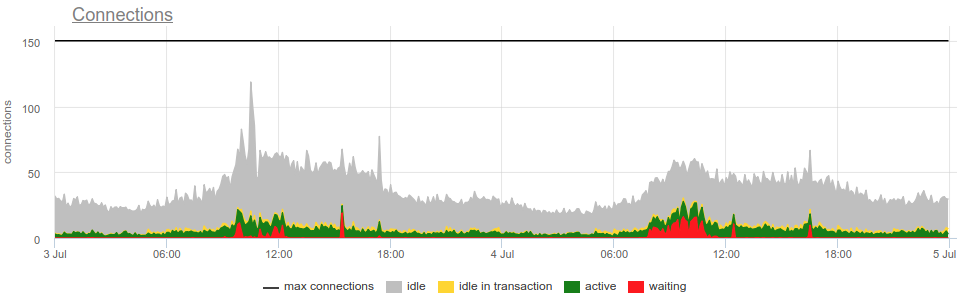 State label indicates these possible states:
- idle — there's no in-flight query or statement executed within this connection.
- idle in transaction indicates, that there's a begun, yet not finished, dangling transaction within a connection, but at the moment there's no in-flight query or statement. Such lingering, idle transactions are "bad" in a sense, that they occupy "valuable" PostgreSQL connections, consuming resources. But also it might lead to extra table bloat, which is bad for PostgreSQL performance. It's an Anti-Pattern for PgSQL applications to hold PostgreSQL transactions while doing some computations.
- active — client, that opened this connection, is performing a query within it at the moment.
- waiting — a query, executed within this connection at the moment, is awaiting release of a lock, acquired by some other client. While it's okay to see connection in that state sometimes, high mumber of those is a sign of a problem with database usage. That might be, for example, a log lasting ALTER statement, or a greedy SELECT FOR UPDATE. Anyways Okmeter will notify you if such waiting connections will be seen, so you won't be in the dark.
- postgresql.settings.max_connections {instance: “Y”, source_hostname: “Z”}
- It tracks current value of a PostgreSQL setting — max_connections — a limit on a number of simultaneous connections. Since every connection to PostgreSQL gets its own OS process forked, it's prodigally to have too many of them, because of possible resources exhaustion. Okmeter will notify you if current connection count approaches this limit, so you'll be able to handle it appropriately.
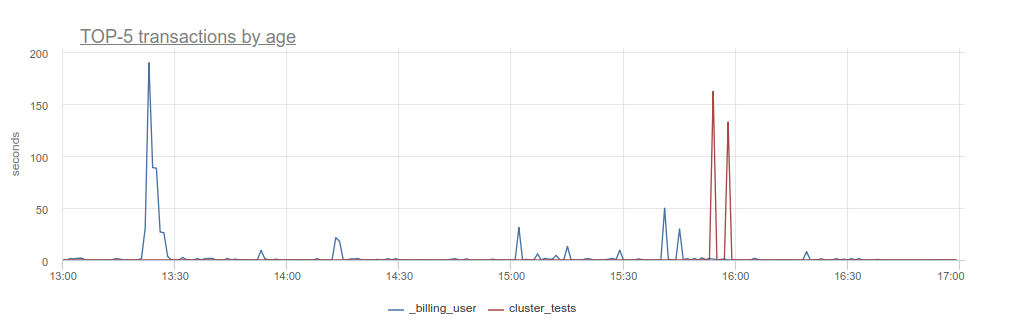
- postgresql.connections.max_transaction_age {database: "D", user: "U", instance: “Y”, source_hostname: “Z”}
-
Okmeter watches for the oldest open transaction from each user to a database. This metric holds its duration. It will help you to see if there's any "stuck" transactions due to a client halt or something else, like here:
Autovacuum monitoring
MVCC, used in PgSQL, leads to a possibility of having simultaneously multiple versions of the same data record / row in a database. Each version having its own visibility — transaction id interval [xmin, xmax], within which this row is accessible.
So PostgreSQL needs to do the following maintenance work:
- Delete old rows versions — whenever some row gets updated, at some point its previous version gets old enough, so it won't be read ever again. After that it needs to be cleaned up, to free up corresponding disk space.
- Handle Transaction ID counter overflow a.k.a. wraparound. Because PostgreSQL uses int32 transaction counter, eventually it will overflow its max value. If not handled in time, this might lead to a `catastrophic data loss`, as PostgreSQL docs says.
With Okmeter you'll get a complete picture of what's happening with your db vacuuming, so you won't miss a thing.
- postgresql.settings.autovacuum_max_workers {instance: “Y”, source_hostname: “Z”}
- Value of a PostgreSQL setting autovacuum_max_workers, which controls the limit on concurrent autovacuum workers.
- postgresql.autovacuum_workers.common {instance: “Y”, source_hostname: “Z”}
- postgresql.autovacuum_workers.wraparound {instance: “Y”, source_hostname: “Z”}
-
Number of autovacuum workers running at the moment, with respect to what's its purpose:
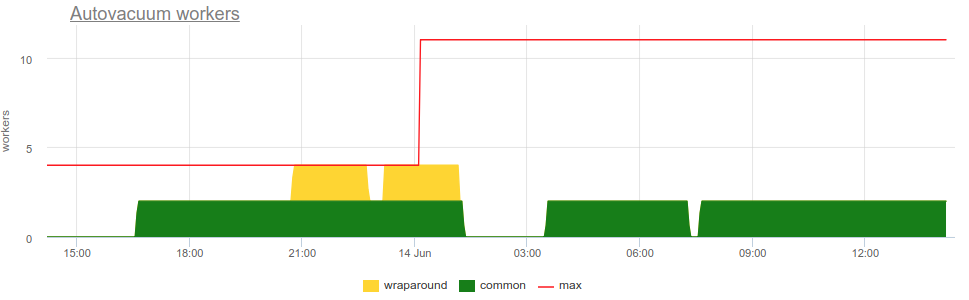
- wraparound — workers clean up ("freeze") old transaction IDs, to prevent transaction ID wraparound data loss.
- common — workers do everything else — seek for "dead" tuples/rows and clean them up.
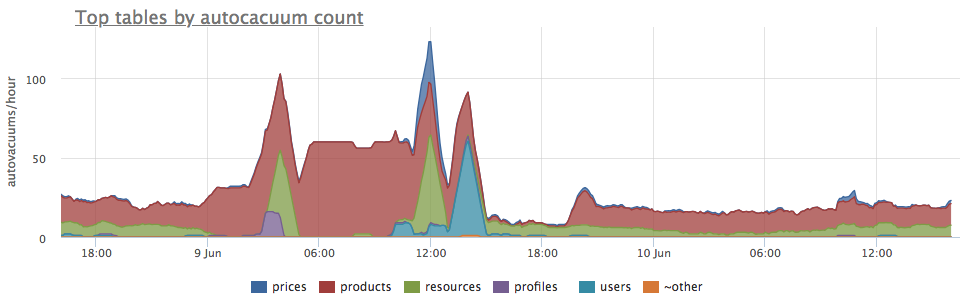
- postgresql.table.autovacuum_count.rate {table: "T", database: "D", instance: “Y”, source_hostname: “Z”}
-
Number of time vacuum has scanned each table.
This gives a picture of what vacuum workers have been occupied with:
- postgresql.db.transactions_left_before_shutdown {database: "D", instance: “Y”, source_hostname: “Z”}
-
Number of transactions left before PostgreSQL instance will be shut down, to prevent possible data loss due to wraparound:
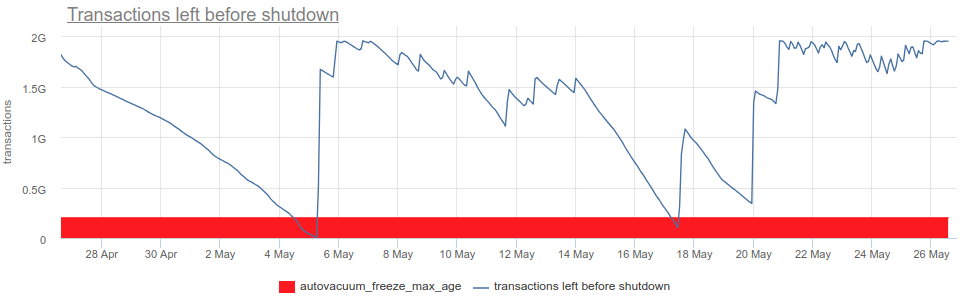 If this is lower than autovacuum_freeze_max_age setting (red on the chart above), PostgreSQL will force an autovacuum on any table that might contain old data, that is endangered due to upcoming wraparound.
But even this, forced vacuuming might not be able to fix everything in time. And once there are fewer than 1 million transactions left until wraparound, PostgreSQL instance will shut down and refuse to start any new transactions:
    ERROR:  database is not accepting commands to avoid wraparound data loss in database "db1",
    HINT:   Stop the postmaster and vacuum that database in single-user mode.
            You might also need to commit or roll back old prepared transactions,
            or drop stale replication slots.
The 1-million-transaction safety margin exists to let the administrator manually recover without data loss.
Okmeter will help you not to fall into such a nasty and dangerous situation. We'll notify you in advance, so that you have time to sort everything out and fix it all!
Background writer monitoring
Bgwriter, background writer, or just writer process is a separate PostgreSQL server process, dedicated to sync "dirty" (new or modified) buffers to disk, so backend processes handling queries don't have to wait for such sync.
- postgresql.bgwriter.buffers_clean {instance: “Y”, source_hostname: “Z”}
- Number of pages/buffers written to disk by bgwriter.
- postgresql.bgwriter.buffers_checkpoint {instance: “Y”, source_hostname: “Z”}
- Count of buffers written during a CHECKPOINT.
- postgresql.bgwriter.buffers_backend {instance: “Y”, source_hostname: “Z”}
-
Number of buffers written directly by a backend processes while handling queries.
So it's the number of immediate writes caused by any operation, e.g. when an INSERT has to flush something on disk, because it has no space left for a new data in shared buffers.
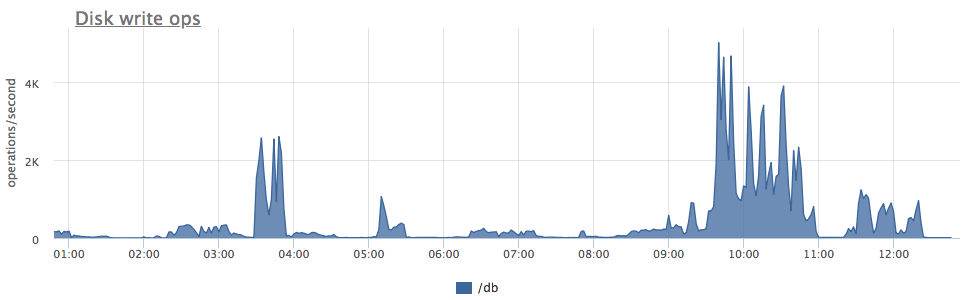
If you chart all those metrics, you'll see which process has been generating disk writes: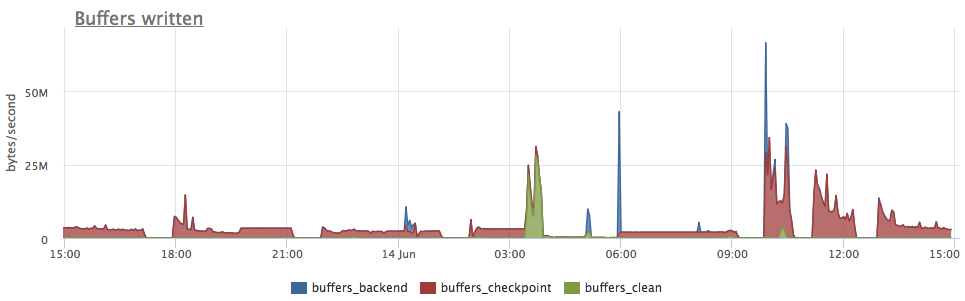
- postgresql.settings.bgwriter_lru_maxpages {instance: “Y”, source_hostname: “Z”}
- Current value of PostgreSQL setting bgwriter_lru_maxpages, that allows to control disk write load generated by bgwriter.
- postgresql.bgwriter.maxwritten_clean {instance: “Y”, source_hostname: “Z”}
- Number of times the background writer stopped a cleaning scan because it had written bgwriter_lru_maxpages buffers in one pass. If you want to make bgwriter do more aggressive cleaning, this metric will help you understand if you need to increase bgwriter_lru_maxpages or change other settings.
Checkpoints monitoring
CHECKPOINT operation forces a transaction log checkpoint, flushing all dirty data pages to disk and writing a special checkpoint record to the WAL file. It's done to minimize amount of WAL REDO in the process of crash recovery.
Checkpoint might start for a number of reasons:
- Manual run of CHECKPOINT SQL command or by management tools while backuping a database etc.
- checkpoint_timeout seconds elapsed since last checkpoint. PostgreSQL setting checkpoint_timeout controls automatical regular creation of checkpoints.
- Or if WAL grows too large since last checkpoint. It's controlled by max_wal_size setting (in bytes) or by checkpoint_segments (in number of segments) for pre-9.5 PostgreSQL versions.
- postgresql.bgwriter.checkpoints_timed {instance: “Y”, source_hostname: “Z”}
- Number of checkpoints performed due to checkpoint_timeout triggered, so called "scheduled" checkpoints.
- postgresql.bgwriter.checkpoints_req {instance: “Y”, source_hostname: “Z”}
-
Number of checkpoints happened due to WAL growth, so called "requested" checkpoints.
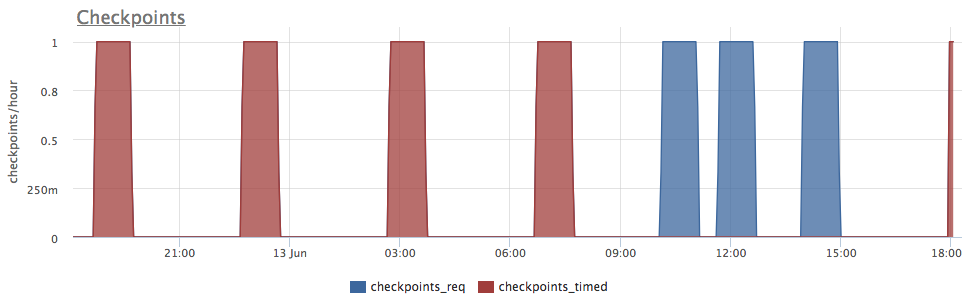 This chart illusrtates a case, when up until 9:00 checkpoints were triggered by timeout ("scheduled") every 4 hours. And you can correlate that to low disk write load on the previous chart. But one can see also that after around 10:00 checkpoints become "requested". Which is perfectly correlates to a higher write load on the previous chart.
There's more!
This is only a part of what Okmeter will collect, monitor and alert you about in your PostgreSQL database.
Okmeter will also show detailed view of all other aspects of DB instance health, such as:
- CPU, memory and disk utilization
- PostgreSQL buffer usage
- Disk and swap usage
- Index scans, Seq scans etc.
- Locks usage and waiting transactions
- INSERT, UPDATE and DELETE operations for each table
- Transaction processing
As you can see, Okmeter provides monitoring for all the parts of PostgreSQL, giving you a complete picture of of database operation and performance. With Okmeter monitoring you'll be prepared to any trouble with PostgreSQL.