A complete solution for PostgreSQL monitoring
Detailed monitoring of all PostgresSQL subsystems
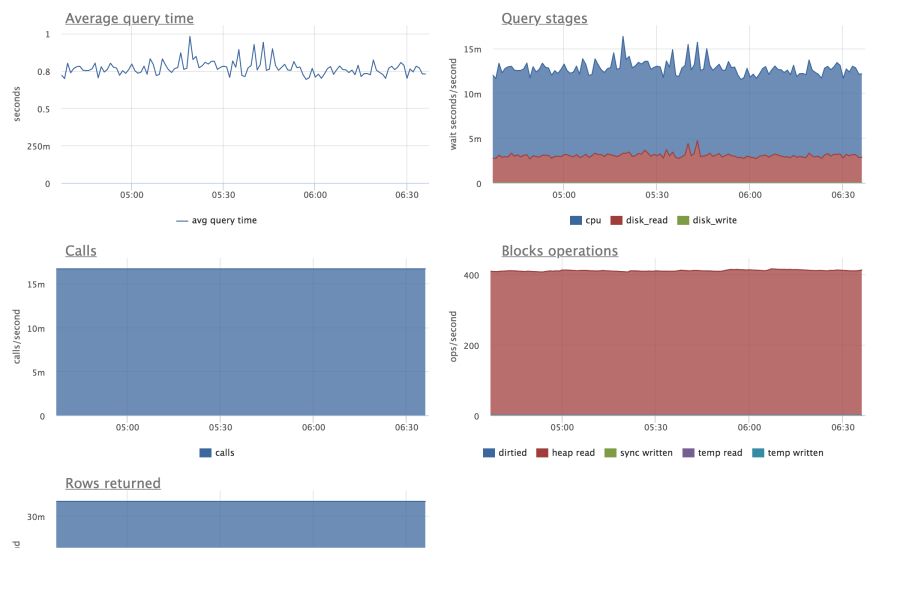
Query execution
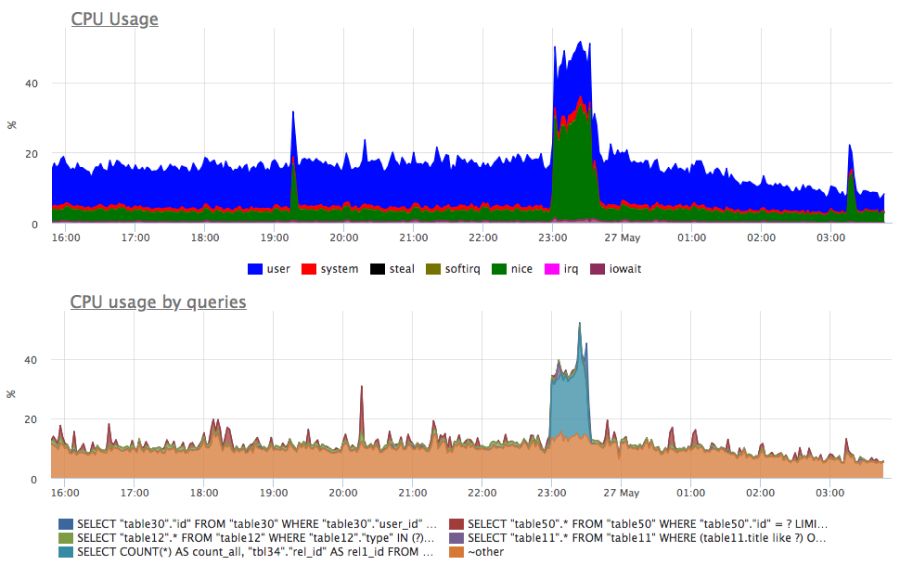
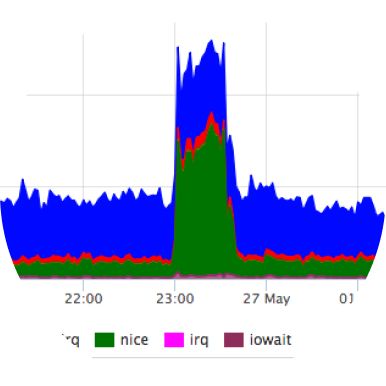
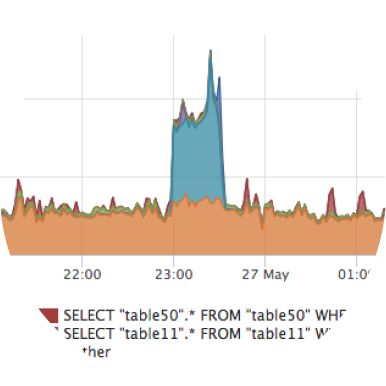
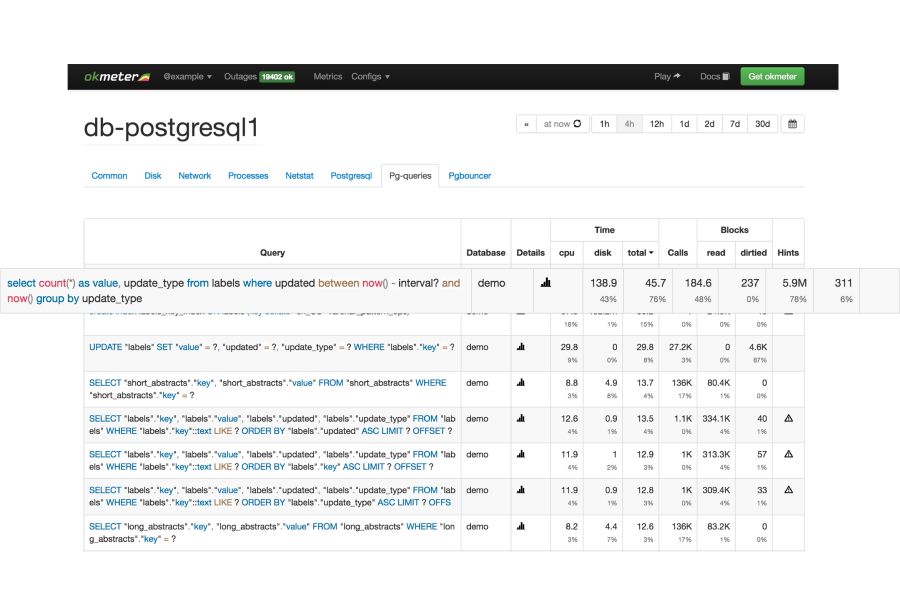
Workload monitoring is the cornerstone of database performance analysis. You'll know whenever some request generates CPU or disks overload. Okmeter will show you exactly which one caused it.
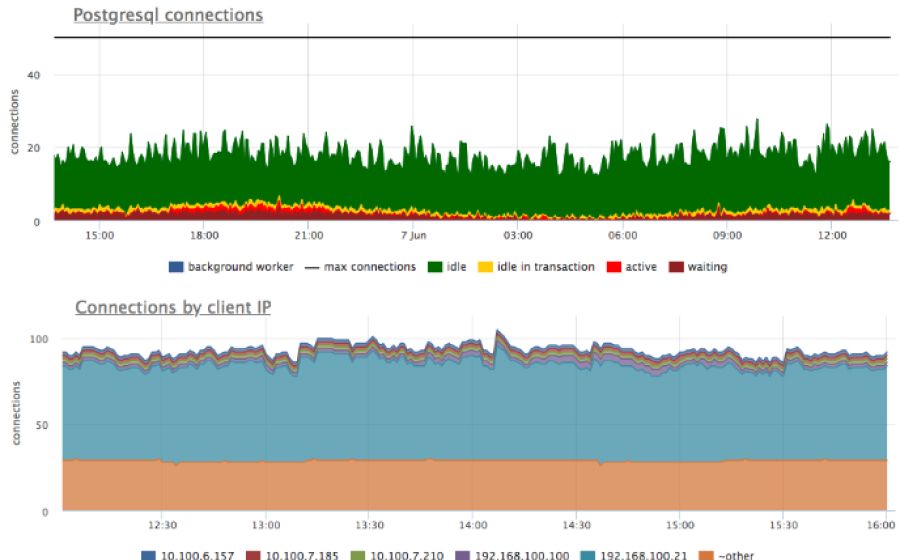
Client connections
You'll be aware which IPs created how many connections, and what states they are in. You'll have a distinct understanding of how many transactions are actively executing queries, how many are idling, and whether some are waiting on locks.
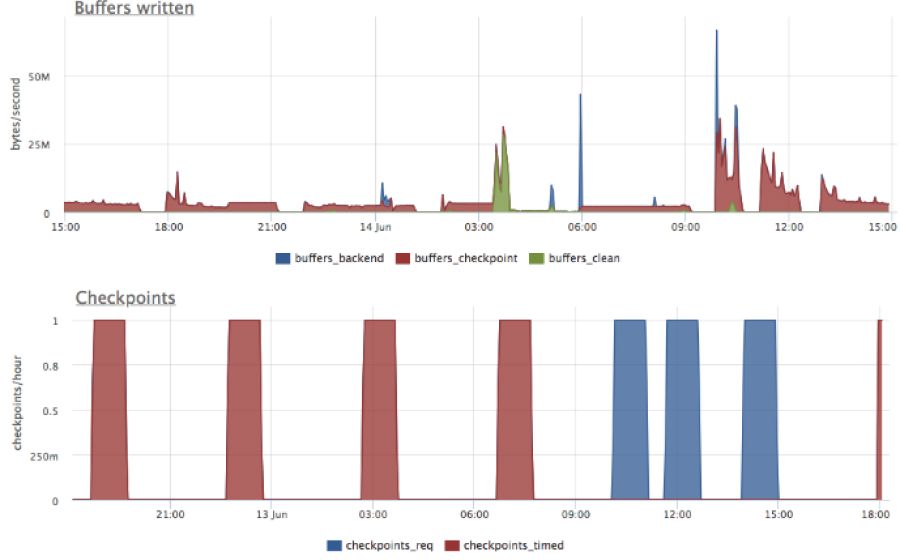
Checkpointer & bgwriter
These are two crucial storage processes in Postgres that write changed data to disks. Their configuration not only defines disk IO load, but query processing times as well.
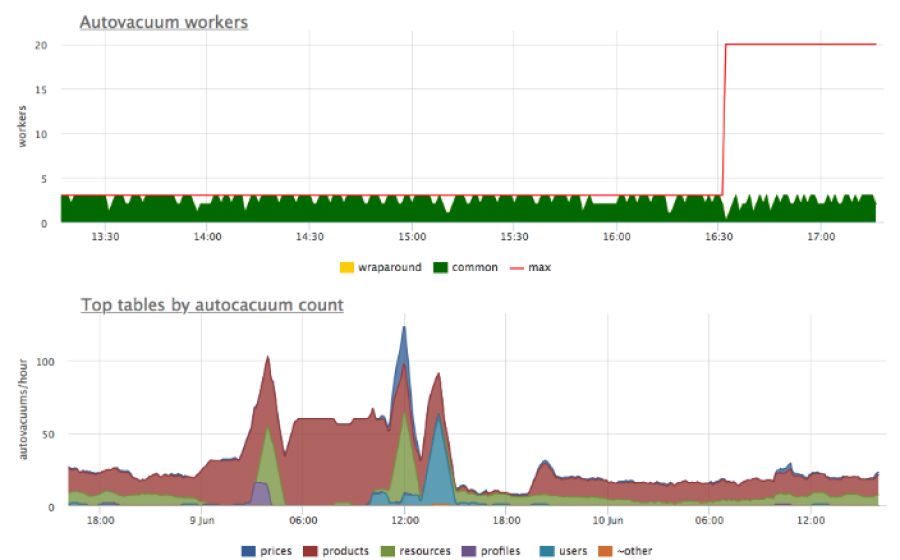
Autovacuum
Autovacuum is a critical Postgres process, designed to clean up unneeded data. It also updates query planner statistics and prevent data loss due to transaction ID wraparound. Be aware of autovacuum operation and its proper setup.
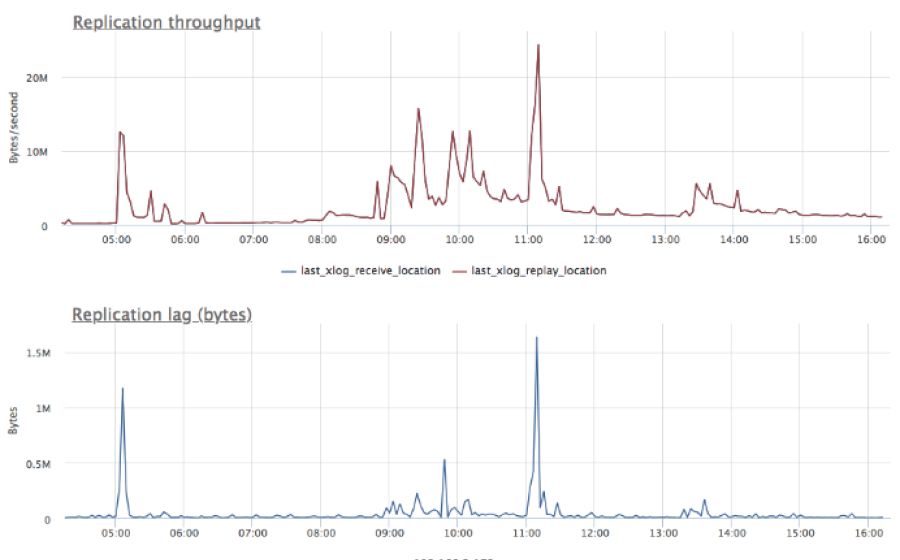
Replication
Postgresql streaming replications if widely used for fault tolerance and scaling, you wouldn't want it to be in a bad condition. Okmeter will keep an eye to ensure it's working well.
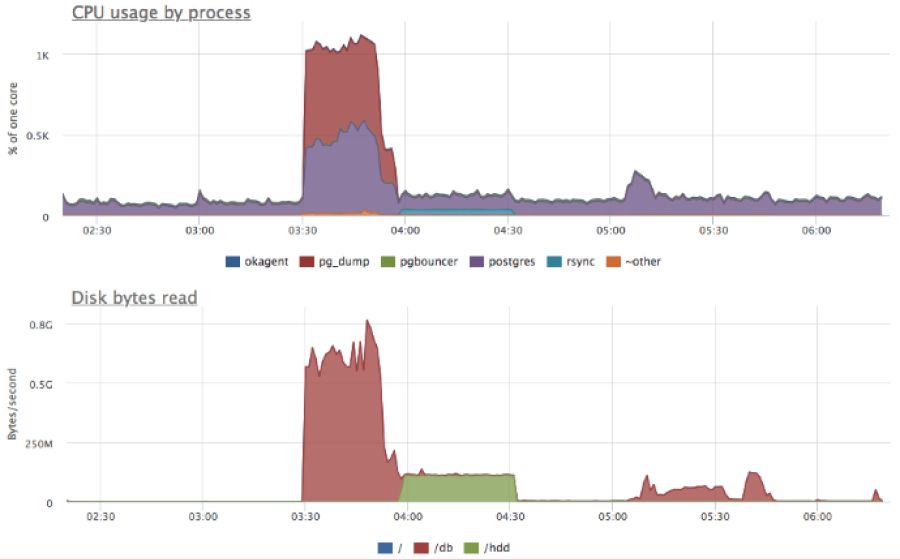
Hardware & OS
Internal Postgres operational metrics are not enough to get a full picture of what's happening on the server. Okmeter has all the system metrics and monitors every process on the server. You'll have preset dashboards and triggers on top of all that.